OPEN-SOURCE SCRIPT
Similar Price Action
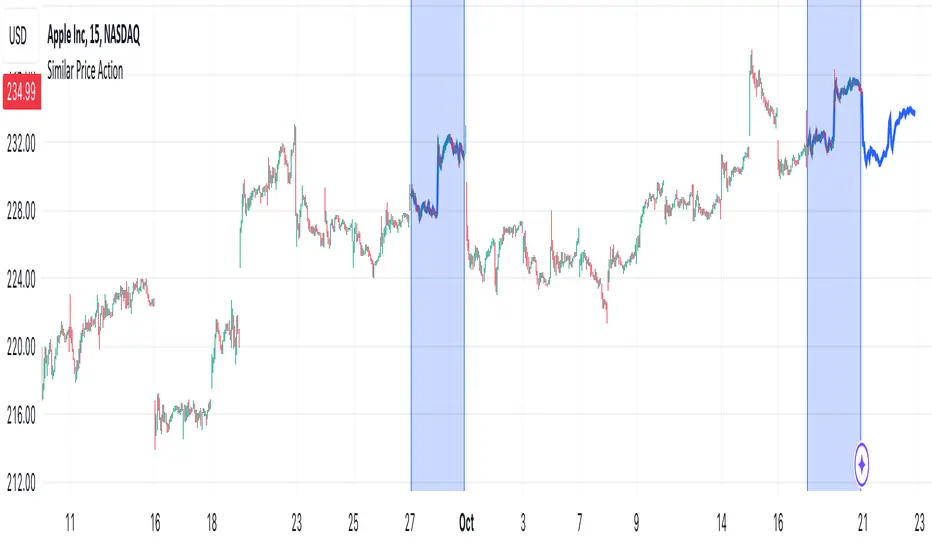
Description:
The indicator tries to find an area of N candles in history that has the most similar price action to the latest N candles. The maximum search distance is limited to 5000 candles. It works by calculating a coefficient for each candle and comparing it with the coefficient of the latest candle, thus searching for two closest values. The indicator highlights the latest N candles, as well as the most similar area found in the past, and also tries to predict future price based on the latest price and price directly after the most similar area that was found in the past.
Inputs:
- Length -> the area we are searching for is comprised of this many candles
- Lookback -> maximum distance in which a similar area can be found
- Function -> the function used to compare latest and past prices
Notes:
- The indicator is intended to work on smaller timeframes where the overall price difference is not very high, but can be used on any
오픈 소스 스크립트
트레이딩뷰의 진정한 정신에 따라, 이 스크립트의 작성자는 이를 오픈소스로 공개하여 트레이더들이 기능을 검토하고 검증할 수 있도록 했습니다. 작성자에게 찬사를 보냅니다! 이 코드는 무료로 사용할 수 있지만, 코드를 재게시하는 경우 하우스 룰이 적용된다는 점을 기억하세요.
면책사항
해당 정보와 게시물은 금융, 투자, 트레이딩 또는 기타 유형의 조언이나 권장 사항으로 간주되지 않으며, 트레이딩뷰에서 제공하거나 보증하는 것이 아닙니다. 자세한 내용은 이용 약관을 참조하세요.
오픈 소스 스크립트
트레이딩뷰의 진정한 정신에 따라, 이 스크립트의 작성자는 이를 오픈소스로 공개하여 트레이더들이 기능을 검토하고 검증할 수 있도록 했습니다. 작성자에게 찬사를 보냅니다! 이 코드는 무료로 사용할 수 있지만, 코드를 재게시하는 경우 하우스 룰이 적용된다는 점을 기억하세요.
면책사항
해당 정보와 게시물은 금융, 투자, 트레이딩 또는 기타 유형의 조언이나 권장 사항으로 간주되지 않으며, 트레이딩뷰에서 제공하거나 보증하는 것이 아닙니다. 자세한 내용은 이용 약관을 참조하세요.