OPEN-SOURCE SCRIPT
업데이트됨 Entry Buy/Sell with Adjustable EMA-WMA Difference by Brian Le
The "Entry Buy/Sell with RSI-WMA Conditions" script, crafted by Brian Le, is a specialized TradingView indicator designed for traders who seek to capitalize on specific RSI (Relative Strength Index) crossover events relative to key moving averages, specifically the EMA (Exponential Moving Average) and WMA (Weighted Moving Average). This tool is particularly useful for identifying potential entry points in a trading strategy, marked by distinctive visual signals on the chart.
Key Features:
Customizable Timeframes and Lengths: Users can adjust the lengths of the RSI, EMA, and WMA, making the indicator versatile across various timeframes and trading styles.
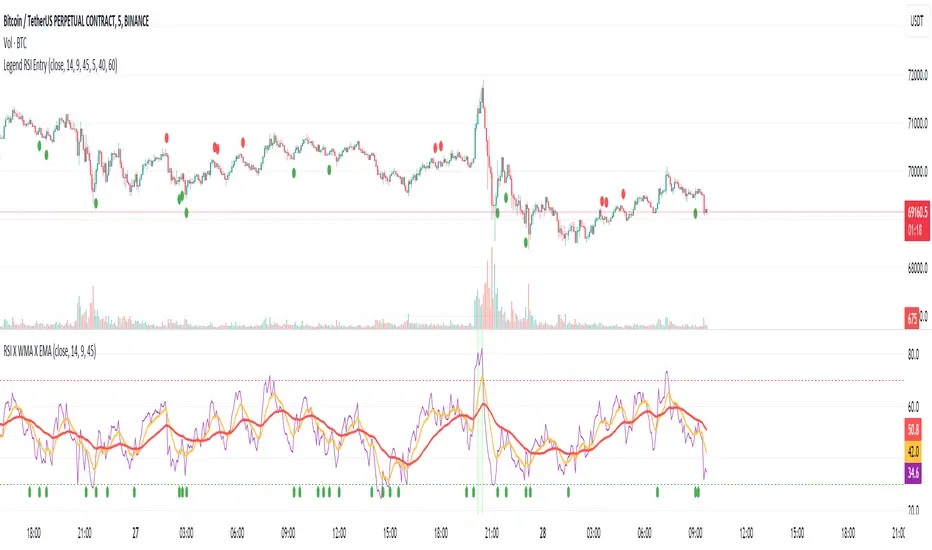
RSI Crossover Signals: The script generates signals based on the RSI crossing over the EMA. A green dot signifies a potential buy signal when the RSI crosses above the EMA, while a red dot indicates a potential sell signal when the RSI crosses below the EMA.
Special Conditions Based on WMA: The indicator enhances decision-making by including the WMA in its analysis. Buy signals (green dots) are only shown when the RSI is below the WMA, and sell signals (red dots) are displayed when the RSI is above the WMA. This additional condition helps in filtering out less probable trades.
EMA and WMA Difference Filter: A unique feature of this script is the ability to set a minimum point difference between the EMA and WMA, adding another layer of specificity to the generated signals.
RSI Threshold Filters: The indicator includes optional filters to show signals only when the RSI is above 40 (for buy signals) or below 60 (for sell signals), aiding in avoiding overbought or oversold conditions.
Enhanced Visuals for Significant Events: For more prominent trading events, such as the RSI crossing both the EMA and WMA within a single candle, the script plots larger symbols (triangles), making these significant events stand out on the chart.
Key Features:
Customizable Timeframes and Lengths: Users can adjust the lengths of the RSI, EMA, and WMA, making the indicator versatile across various timeframes and trading styles.
RSI Crossover Signals: The script generates signals based on the RSI crossing over the EMA. A green dot signifies a potential buy signal when the RSI crosses above the EMA, while a red dot indicates a potential sell signal when the RSI crosses below the EMA.
Special Conditions Based on WMA: The indicator enhances decision-making by including the WMA in its analysis. Buy signals (green dots) are only shown when the RSI is below the WMA, and sell signals (red dots) are displayed when the RSI is above the WMA. This additional condition helps in filtering out less probable trades.
EMA and WMA Difference Filter: A unique feature of this script is the ability to set a minimum point difference between the EMA and WMA, adding another layer of specificity to the generated signals.
RSI Threshold Filters: The indicator includes optional filters to show signals only when the RSI is above 40 (for buy signals) or below 60 (for sell signals), aiding in avoiding overbought or oversold conditions.
Enhanced Visuals for Significant Events: For more prominent trading events, such as the RSI crossing both the EMA and WMA within a single candle, the script plots larger symbols (triangles), making these significant events stand out on the chart.
릴리즈 노트
AddedCustom RSI Buy and Sell Levels: Users can now specify custom RSI levels for buy and sell conditions. This allows for more precise control over the entry signals based on RSI values.
Added input rsi_buy_level to set the RSI threshold for buy conditions.
Added input rsi_sell_level to set the RSI threshold for sell conditions.
Modified
Final Buy and Sell Conditions: Adjusted the logic for final buy and sell conditions to utilize the new custom RSI buy and sell levels if the respective RSI filter is enabled.
finalBuyCondition now checks rsi > rsi_buy_level instead of a fixed value of rsi > 40.
finalSellCondition now checks rsi < rsi_sell_level instead of a fixed value of rsi < 60.
오픈 소스 스크립트
트레이딩뷰의 진정한 정신에 따라, 이 스크립트의 작성자는 이를 오픈소스로 공개하여 트레이더들이 기능을 검토하고 검증할 수 있도록 했습니다. 작성자에게 찬사를 보냅니다! 이 코드는 무료로 사용할 수 있지만, 코드를 재게시하는 경우 하우스 룰이 적용된다는 점을 기억하세요.
면책사항
해당 정보와 게시물은 금융, 투자, 트레이딩 또는 기타 유형의 조언이나 권장 사항으로 간주되지 않으며, 트레이딩뷰에서 제공하거나 보증하는 것이 아닙니다. 자세한 내용은 이용 약관을 참조하세요.
오픈 소스 스크립트
트레이딩뷰의 진정한 정신에 따라, 이 스크립트의 작성자는 이를 오픈소스로 공개하여 트레이더들이 기능을 검토하고 검증할 수 있도록 했습니다. 작성자에게 찬사를 보냅니다! 이 코드는 무료로 사용할 수 있지만, 코드를 재게시하는 경우 하우스 룰이 적용된다는 점을 기억하세요.
면책사항
해당 정보와 게시물은 금융, 투자, 트레이딩 또는 기타 유형의 조언이나 권장 사항으로 간주되지 않으며, 트레이딩뷰에서 제공하거나 보증하는 것이 아닙니다. 자세한 내용은 이용 약관을 참조하세요.