OPEN-SOURCE SCRIPT
업데이트됨 Sacred Geometry by DGT
Sacred geometry ascribes symbolic and sacred meanings to certain geometric shapes and certain geometric proportions. The study of sacred geometry has its roots in the study of nature, and the mathematical principles at work therein
In trading, using geometry for technical analysis is highly used concept, such as Gann Tools, Fibonacci Tools, Elliott Wave Theory are some examples that are based on the idea that the market is geometric and cyclical in nature
Thanks to AtomOfScent's "almost like sacred geometry" comment to FibFans on Previous HTF HL
study give me the idea to go further and to demonstrate just how far we can go with this style of analysis. And here comes an experimental attempt to present some of sacred geometric shapes such as Seed of Life, Fruit of Life and Spiral, where the resulting image may help technical analysts to predict price changes.
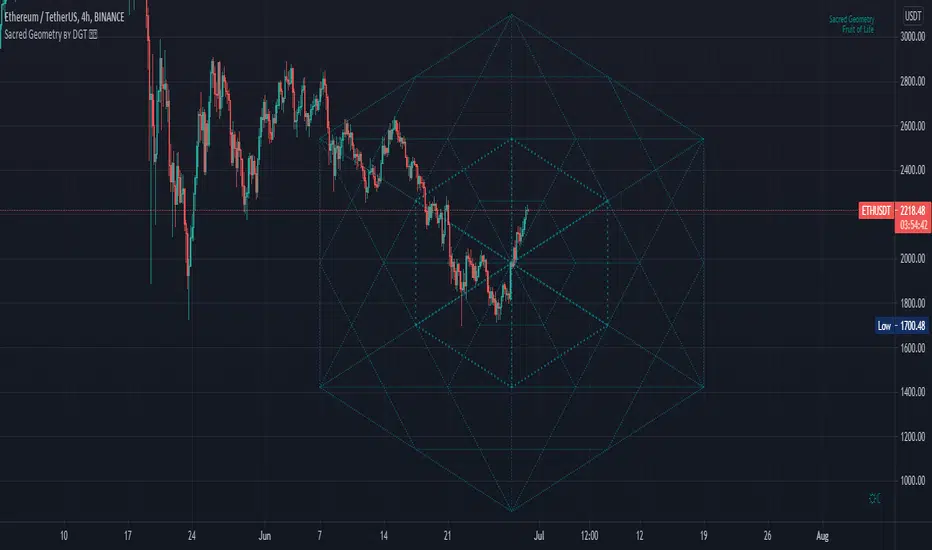
Fruit of Life, example and how it is derived (maximum line limitation does not allow to draw all circles, so red circles are drawn manually to present the idea). Fruit of Life is base for the Metatron’s Cube and we can create all five Platonic Solids from it (Hexahedron, Tetrahedron, Octahedron, Icosahedron and Dodecahedron)


Spiral Examples :


Again special thanks to AtomOfScent for commenting on the draft version of the study as well as providing valuable suggestions.
Disclaimer:
Trading success is all about following your trading strategy and the indicators should fit within your trading strategy, and not to be traded upon solely
The script is for informational and educational purposes only. Use of the script does not constitute professional and/or financial advice. You alone have the sole responsibility of evaluating the script output and risks associated with the use of the script. In exchange for using the script, you agree not to hold dgtrd TradingView user liable for any possible claim for damages arising from any decision you make based on use of the script
In trading, using geometry for technical analysis is highly used concept, such as Gann Tools, Fibonacci Tools, Elliott Wave Theory are some examples that are based on the idea that the market is geometric and cyclical in nature
Thanks to AtomOfScent's "almost like sacred geometry" comment to FibFans on Previous HTF HL
study give me the idea to go further and to demonstrate just how far we can go with this style of analysis. And here comes an experimental attempt to present some of sacred geometric shapes such as Seed of Life, Fruit of Life and Spiral, where the resulting image may help technical analysts to predict price changes.
Fruit of Life, example and how it is derived (maximum line limitation does not allow to draw all circles, so red circles are drawn manually to present the idea). Fruit of Life is base for the Metatron’s Cube and we can create all five Platonic Solids from it (Hexahedron, Tetrahedron, Octahedron, Icosahedron and Dodecahedron)
Spiral Examples :
Again special thanks to AtomOfScent for commenting on the draft version of the study as well as providing valuable suggestions.
Disclaimer:
Trading success is all about following your trading strategy and the indicators should fit within your trading strategy, and not to be traded upon solely
The script is for informational and educational purposes only. Use of the script does not constitute professional and/or financial advice. You alone have the sole responsibility of evaluating the script output and risks associated with the use of the script. In exchange for using the script, you agree not to hold dgtrd TradingView user liable for any possible claim for damages arising from any decision you make based on use of the script
릴리즈 노트
added Yin Yang 릴리즈 노트
added Sri YantraSpecial thnaks to sandyrindal and AtomOfScent
릴리즈 노트
table texts made smaller - no functional changeps : with non-circled sacred geometric shapes, extending lines may result with better experience observing trend lines and support & resistance levels
오픈 소스 스크립트
트레이딩뷰의 진정한 정신에 따라, 이 스크립트의 작성자는 이를 오픈소스로 공개하여 트레이더들이 기능을 검토하고 검증할 수 있도록 했습니다. 작성자에게 찬사를 보냅니다! 이 코드는 무료로 사용할 수 있지만, 코드를 재게시하는 경우 하우스 룰이 적용된다는 점을 기억하세요.
Premium Indicators – Try Free for 15 Days: sites.google.com/view/solemare-analytics
면책사항
해당 정보와 게시물은 금융, 투자, 트레이딩 또는 기타 유형의 조언이나 권장 사항으로 간주되지 않으며, 트레이딩뷰에서 제공하거나 보증하는 것이 아닙니다. 자세한 내용은 이용 약관을 참조하세요.