INVITE-ONLY SCRIPT
YK_28CRYPTO_CCI_Custom
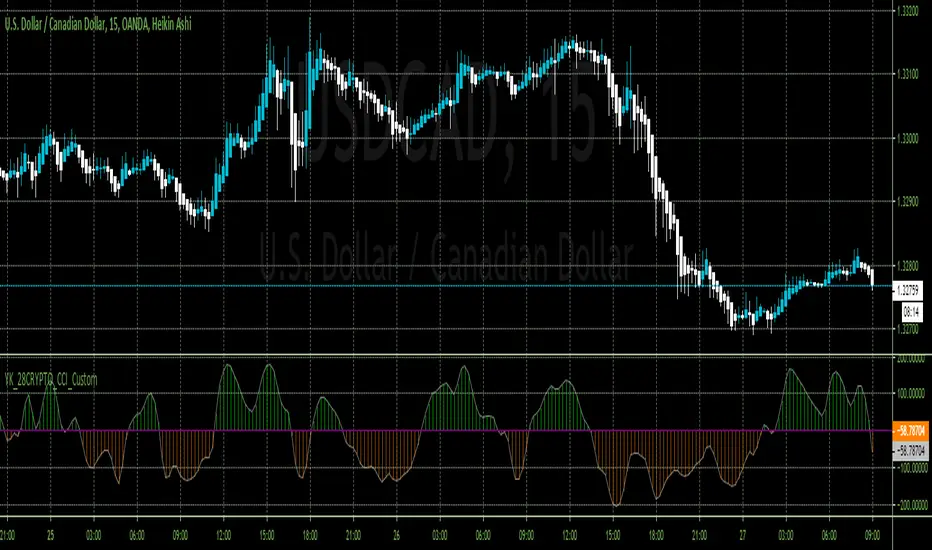
Modified CCI for Heiken Ashi charts
The CCI usually falls in a channel of -100 to 100. The conventional CCI trading system works as follows. When it rises above 100, buy and hold until CCI falls back below 100. When CCI falls below -100, sell short and cover the short when it rises above the -100 line. Some trading systems cover on a rise above minus 85. The following scans represent this strategy.
Buy Signal CCI > 100 AND CCI.1 <= 100
Sell Signal CCI < -100 AND CCI.1 >= -100
A more aggressive use of the CCI indicator dictates entering positions when the index crosses the 0 line. This method helps incorporate the early part of a new move. When the CCI crosses above the 0 line from negative territory, this is a bullish signal. When the CCI crosses below the 0 line from positive territory, this is a bearish signal.
Buy Signal CCI > 0 AND CCI.1 <= 0
Sell Signal CCI < 0 AND CCI.1 >= 0
Modified CCI When "Modified CCI" is checked, the Typical Price is calculated differently, as seen below. Otherwise, the calculations are identical.
TP = (Max(HI,n) + Min(LO,n) + CL) / 3 n = CCI Period TP stands for Typical Price
Also long trades should be supported in combination with RSI going above 40 for Forex and above 50 for Crypto
Same for short trades 40/30 correlated
초대 전용 스크립트
이 스크립트는 작성자가 승인한 사용자만 접근할 수 있습니다. 사용하려면 요청을 보내고 승인을 받아야 합니다. 일반적으로 결제 후에 승인이 이루어집니다. 자세한 내용은 아래 작성자의 지침을 따르거나 Senin에게 직접 문의하세요.
트레이딩뷰는 스크립트 작성자를 완전히 신뢰하고 스크립트 작동 방식을 이해하지 않는 한 스크립트 비용을 지불하거나 사용하지 않는 것을 권장하지 않습니다. 무료 오픈소스 대체 스크립트는 커뮤니티 스크립트에서 찾을 수 있습니다.
작성자 지시 사항
면책사항
이 정보와 게시물은 TradingView에서 제공하거나 보증하는 금융, 투자, 거래 또는 기타 유형의 조언이나 권고 사항을 의미하거나 구성하지 않습니다. 자세한 내용은 이용 약관을 참고하세요.