OPEN-SOURCE SCRIPT
Cumulative Gain/Loss Histogram
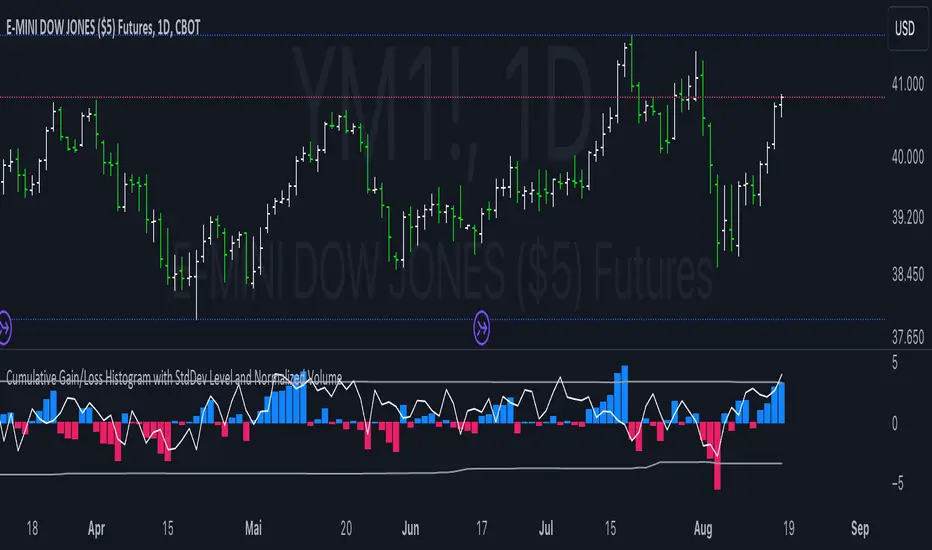
This TradingView Pine Script indicator combines several analytical tools to assist traders in making informed investment decisions. It calculates and visualizes cumulative gain/loss percentage, standard deviation levels, and normalizes trading volume on a reversed scale.
Components:
Basis for Calculation:
Users can select the basis data for the calculations: Price, VIX (Volatility Index), VVIX (Volatility of Volatility Index), or MOVE (Volatility Index for Treasury Securities).
Cumulative Gain/Loss:
This is computed based on the selected basis. The script tracks the cumulative percentage change in the selected basis data. Positive changes are aggregated to track gains, while negative changes accumulate to track losses.
Standard Deviation Levels:
The script calculates standard deviation (StdDev) for the cumulative gain/loss data over a specified period. Two levels are determined:
Positive StdDev Level: Shows the upper threshold for gains.
Negative StdDev Level: Shows the lower threshold for losses.
These levels are useful for identifying extreme deviations in the data.
Normalized Volume:
The trading volume is normalized to fit within a -5 to 5 scale, but the scale is reversed. Higher trading volumes will be represented by lower values on this scale. This normalized volume is plotted as a gray line on the chart.
How to Use This Indicator:
Identify Trends and Extremes:
Cumulative Gain/Loss: Look for periods where the cumulative gain/loss exceeds the standard deviation levels. This can indicate significant trend changes or potential reversals. Standard Deviation Levels: Use these levels to gauge whether the market is experiencing extreme conditions. For example, if the cumulative gain/loss crosses above the positive StdDev level, it might suggest an overbought condition.
Volume Analysis:
Normalized Volume: Analyze the volume trends with the reversed scale. Higher normalized volume values (which are lower on the -5 to 5 scale) could indicate high trading activity or market interest, potentially signaling a strong move or trend. Conversely, lower normalized volume values (which are higher on the -5 to 5 scale) may suggest lower trading activity or consolidation.
Decision-Making:
Combine the insights from cumulative gain/loss and standard deviation levels with volume analysis to make more informed trading decisions.
Buy Signal: Consider entering a position when the cumulative gain/loss reaches or exceeds the negative StdDev level and volume analysis supports increased market activity.
Sell Signal: Consider exiting a position when the cumulative gain/loss exceeds the positive StdDev level, indicating possible overbought conditions, especially if volume trends also align with the potential reversal.
Summary:
This script is designed to help traders understand market dynamics through cumulative gain/loss trends, standard deviation thresholds, and volume analysis. By interpreting these elements together, traders can identify potential trading opportunities and make more informed decisions based on market conditions and trends.
오픈 소스 스크립트
트레이딩뷰의 진정한 정신에 따라, 이 스크립트의 작성자는 이를 오픈소스로 공개하여 트레이더들이 기능을 검토하고 검증할 수 있도록 했습니다. 작성자에게 찬사를 보냅니다! 이 코드는 무료로 사용할 수 있지만, 코드를 재게시하는 경우 하우스 룰이 적용된다는 점을 기억하세요.
Where others speculate, we systematize.
edgetools.org
edgetools.org
면책사항
해당 정보와 게시물은 금융, 투자, 트레이딩 또는 기타 유형의 조언이나 권장 사항으로 간주되지 않으며, 트레이딩뷰에서 제공하거나 보증하는 것이 아닙니다. 자세한 내용은 이용 약관을 참조하세요.