PROTECTED SOURCE SCRIPT
업데이트됨 Uptrick: Comprehensive Market Sentiment Dashboard
Introducing "Uptrick: Comprehensive Market Sentiment Dashboard"—an advanced trading indicator designed to provide traders with a complete and detailed overview of market conditions for multiple assets at a glance. This sophisticated tool is engineered to enhance your trading decisions by consolidating key technical indicators into a single, easy-to-read dashboard. Perfect for both novice and experienced traders, the Uptrick Dashboard is built to offer a competitive edge in the dynamic world of trading.
### Purpose
The primary goal of the Uptrick Dashboard is to equip traders with a powerful, all-in-one solution that streamlines market analysis. By combining multiple technical indicators and presenting their outputs in a cohesive format, this dashboard eliminates the need to toggle between different charts and tools. It delivers a clear, immediate understanding of market sentiment across various assets, enabling faster and more informed trading decisions.
### Features and Inputs
The Uptrick Dashboard integrates several widely-used technical indicators, each customizable to fit your specific trading strategy. Here’s a detailed breakdown of the features and input parameters:
1. **Exponential Moving Average (EMA)**
- **Input Parameter:** EMA Length
- **Purpose:** Tracks the asset’s price trend by smoothing out price data over a specified period.
2. **Simple Moving Average (SMA)**
- **Input Parameter:** SMA Length
- **Purpose:** Provides a simpler, more straightforward calculation of price trends compared to EMA.
3. **Relative Strength Index (RSI)**
- **Input Parameter:** RSI Length
- **Purpose:** Measures the magnitude of recent price changes to evaluate overbought or oversold conditions.
4. **Moving Average Convergence Divergence (MACD)**
- **Input Parameters:** MACD Fast Length, MACD Slow Length, MACD Signal Length
- **Purpose:** Identifies changes in the strength, direction, momentum, and duration of a trend.
5. **Bollinger Bands (BB)**
- **Input Parameters:** BB Length, BB StdDev
- **Purpose:** Provides a visual representation of volatility and relative price levels over a specified period.
6. **Ichimoku Cloud**
- **Input Parameters:** Ichimoku Tenkan Length, Ichimoku Kijun Length, Ichimoku Span A Length, Ichimoku Span B Length
- **Purpose:** Offers a comprehensive view of support and resistance levels, momentum, and trend direction.
7. **Supertrend**
- **Input Parameters:** Supertrend ATR Length, Supertrend Multiplier
- **Purpose:** Combines trend direction and volatility to provide buy and sell signals.
8. **Symbols Input**
- **Input Parameter:** Symbols (comma separated)
- **Purpose:** Allows users to specify and monitor multiple assets simultaneously.
### Customization and Flexibility
Each indicator within the Uptrick Dashboard is fully customizable, allowing you to adjust parameters to align with your trading strategy. Whether you prefer short-term trading with faster indicators or long-term analysis with slower, more reliable data, this dashboard can be tailored to meet your needs.
### Key Differentiators
What sets the Uptrick Dashboard apart from other market sentiment tools is its unparalleled integration of multiple technical indicators into a single, comprehensive view. This consolidation not only saves time but also provides a more holistic understanding of market conditions. Here’s what makes the Uptrick Dashboard unique:
- **Integrated Analysis:** Combines multiple indicators to provide a unified market sentiment.
- **Customizable Inputs:** Each indicator can be adjusted to suit your specific trading strategy.
- **Multi-Asset Monitoring:** Track and analyze several assets simultaneously.
- **User-Friendly Interface:** Designed for ease of use, presenting data in an organized, visually appealing format.
- **Real-Time Updates:** Continuously updates to reflect the latest market data.
### Future Updates
We are committed to continually improving the Uptrick Dashboard to ensure it remains a valuable tool in your trading arsenal. Users can expect regular updates that will introduce new features, enhance existing functionalities, and incorporate user feedback. Future updates may include:
- **Additional Indicators:** Introducing new technical indicators to provide even deeper insights.
- **Enhanced Visualization:** Improved graphical representations for better data interpretation.
- **Automation Features:** Tools to automate certain trading strategies based on indicator outputs.
- **User Customization:** More options for personalizing the dashboard to fit individual preferences.
### How It Works
The Uptrick Dashboard operates by calculating key technical indicators for each specified asset and displaying the results in a neatly organized table. Here’s a closer look at how it works:
1. **Input Parameters:** Users input their preferred settings for each indicator, including the list of assets to monitor.
2. **Data Retrieval:** The dashboard retrieves real-time market data for each specified asset.
3. **Indicator Calculation:** Using the input parameters, the dashboard calculates the values for each technical indicator.
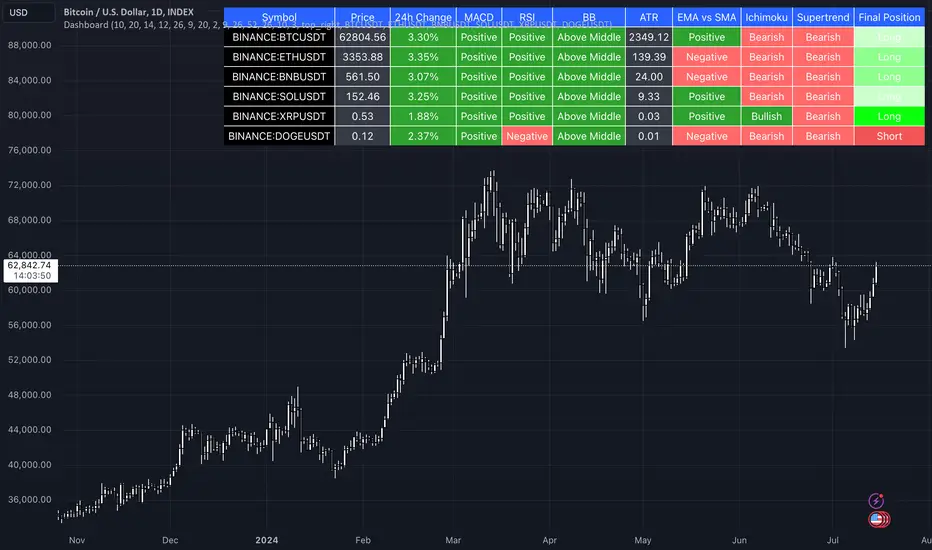
4. **Visual Display:** Results are displayed in a table format, highlighting key information such as price, 24-hour change, and sentiment indicators (e.g., MACD, RSI, Bollinger Bands).
5. **Final Position:** The dashboard calculates an overall market position (Long, Short, or Neutral) based on the combined outputs of the individual indicators.
### Conclusion
The "Uptrick: Comprehensive Market Sentiment Dashboard" is a must-have tool for traders seeking a streamlined, efficient way to monitor market conditions across multiple assets. By integrating essential technical indicators into a single, customizable dashboard, it provides a comprehensive view of market sentiment, facilitating quicker and more informed trading decisions. Stay ahead of the market with Uptrick and experience the difference that a well-designed, all-in-one trading tool can make.
With regular updates and a commitment to excellence, the Uptrick Dashboard is poised to evolve continually, adapting to the changing needs of traders and the dynamics of the market. Whether you’re a seasoned trader or just starting out, the Uptrick Dashboard offers the insights and flexibility needed to enhance your trading strategy. Invest in the Uptrick Dashboard today and take your trading to the next level.
### Purpose
The primary goal of the Uptrick Dashboard is to equip traders with a powerful, all-in-one solution that streamlines market analysis. By combining multiple technical indicators and presenting their outputs in a cohesive format, this dashboard eliminates the need to toggle between different charts and tools. It delivers a clear, immediate understanding of market sentiment across various assets, enabling faster and more informed trading decisions.
### Features and Inputs
The Uptrick Dashboard integrates several widely-used technical indicators, each customizable to fit your specific trading strategy. Here’s a detailed breakdown of the features and input parameters:
1. **Exponential Moving Average (EMA)**
- **Input Parameter:** EMA Length
- **Purpose:** Tracks the asset’s price trend by smoothing out price data over a specified period.
2. **Simple Moving Average (SMA)**
- **Input Parameter:** SMA Length
- **Purpose:** Provides a simpler, more straightforward calculation of price trends compared to EMA.
3. **Relative Strength Index (RSI)**
- **Input Parameter:** RSI Length
- **Purpose:** Measures the magnitude of recent price changes to evaluate overbought or oversold conditions.
4. **Moving Average Convergence Divergence (MACD)**
- **Input Parameters:** MACD Fast Length, MACD Slow Length, MACD Signal Length
- **Purpose:** Identifies changes in the strength, direction, momentum, and duration of a trend.
5. **Bollinger Bands (BB)**
- **Input Parameters:** BB Length, BB StdDev
- **Purpose:** Provides a visual representation of volatility and relative price levels over a specified period.
6. **Ichimoku Cloud**
- **Input Parameters:** Ichimoku Tenkan Length, Ichimoku Kijun Length, Ichimoku Span A Length, Ichimoku Span B Length
- **Purpose:** Offers a comprehensive view of support and resistance levels, momentum, and trend direction.
7. **Supertrend**
- **Input Parameters:** Supertrend ATR Length, Supertrend Multiplier
- **Purpose:** Combines trend direction and volatility to provide buy and sell signals.
8. **Symbols Input**
- **Input Parameter:** Symbols (comma separated)
- **Purpose:** Allows users to specify and monitor multiple assets simultaneously.
### Customization and Flexibility
Each indicator within the Uptrick Dashboard is fully customizable, allowing you to adjust parameters to align with your trading strategy. Whether you prefer short-term trading with faster indicators or long-term analysis with slower, more reliable data, this dashboard can be tailored to meet your needs.
### Key Differentiators
What sets the Uptrick Dashboard apart from other market sentiment tools is its unparalleled integration of multiple technical indicators into a single, comprehensive view. This consolidation not only saves time but also provides a more holistic understanding of market conditions. Here’s what makes the Uptrick Dashboard unique:
- **Integrated Analysis:** Combines multiple indicators to provide a unified market sentiment.
- **Customizable Inputs:** Each indicator can be adjusted to suit your specific trading strategy.
- **Multi-Asset Monitoring:** Track and analyze several assets simultaneously.
- **User-Friendly Interface:** Designed for ease of use, presenting data in an organized, visually appealing format.
- **Real-Time Updates:** Continuously updates to reflect the latest market data.
### Future Updates
We are committed to continually improving the Uptrick Dashboard to ensure it remains a valuable tool in your trading arsenal. Users can expect regular updates that will introduce new features, enhance existing functionalities, and incorporate user feedback. Future updates may include:
- **Additional Indicators:** Introducing new technical indicators to provide even deeper insights.
- **Enhanced Visualization:** Improved graphical representations for better data interpretation.
- **Automation Features:** Tools to automate certain trading strategies based on indicator outputs.
- **User Customization:** More options for personalizing the dashboard to fit individual preferences.
### How It Works
The Uptrick Dashboard operates by calculating key technical indicators for each specified asset and displaying the results in a neatly organized table. Here’s a closer look at how it works:
1. **Input Parameters:** Users input their preferred settings for each indicator, including the list of assets to monitor.
2. **Data Retrieval:** The dashboard retrieves real-time market data for each specified asset.
3. **Indicator Calculation:** Using the input parameters, the dashboard calculates the values for each technical indicator.
4. **Visual Display:** Results are displayed in a table format, highlighting key information such as price, 24-hour change, and sentiment indicators (e.g., MACD, RSI, Bollinger Bands).
5. **Final Position:** The dashboard calculates an overall market position (Long, Short, or Neutral) based on the combined outputs of the individual indicators.
### Conclusion
The "Uptrick: Comprehensive Market Sentiment Dashboard" is a must-have tool for traders seeking a streamlined, efficient way to monitor market conditions across multiple assets. By integrating essential technical indicators into a single, customizable dashboard, it provides a comprehensive view of market sentiment, facilitating quicker and more informed trading decisions. Stay ahead of the market with Uptrick and experience the difference that a well-designed, all-in-one trading tool can make.
With regular updates and a commitment to excellence, the Uptrick Dashboard is poised to evolve continually, adapting to the changing needs of traders and the dynamics of the market. Whether you’re a seasoned trader or just starting out, the Uptrick Dashboard offers the insights and flexibility needed to enhance your trading strategy. Invest in the Uptrick Dashboard today and take your trading to the next level.
릴리즈 노트
In this update, we 'symbols order' input as it wasn't useful, and we updated the code so that it fetches all the data from the current timeframe.릴리즈 노트
In this update, I corrected the Bollinger Bands calculation to make it more accurate.보호된 스크립트입니다
이 스크립트는 비공개 소스로 게시됩니다. 하지만 이를 자유롭게 제한 없이 사용할 수 있습니다 – 자세한 내용은 여기에서 확인하세요.
💎 Free Discord: discord.gg/Def47ueyuD
💎 Website: uptrick.io
Nothing is financial advice. Always do your own research.
💎 Website: uptrick.io
Nothing is financial advice. Always do your own research.
면책사항
해당 정보와 게시물은 금융, 투자, 트레이딩 또는 기타 유형의 조언이나 권장 사항으로 간주되지 않으며, 트레이딩뷰에서 제공하거나 보증하는 것이 아닙니다. 자세한 내용은 이용 약관을 참조하세요.
보호된 스크립트입니다
이 스크립트는 비공개 소스로 게시됩니다. 하지만 이를 자유롭게 제한 없이 사용할 수 있습니다 – 자세한 내용은 여기에서 확인하세요.
💎 Free Discord: discord.gg/Def47ueyuD
💎 Website: uptrick.io
Nothing is financial advice. Always do your own research.
💎 Website: uptrick.io
Nothing is financial advice. Always do your own research.
면책사항
해당 정보와 게시물은 금융, 투자, 트레이딩 또는 기타 유형의 조언이나 권장 사항으로 간주되지 않으며, 트레이딩뷰에서 제공하거나 보증하는 것이 아닙니다. 자세한 내용은 이용 약관을 참조하세요.