PINE LIBRARY
SIC_TICKER_DATA
The SIC Ticker Data is an advanced and efficient library for ticker-to-industry classification and sector analysis. Built with enterprise-grade performance optimizations, this library provides instant access to SIC codes, industry classifications, and peer company data for comprehensive market analysis.
Perfect for: Sector rotation strategies, peer analysis, portfolio diversification, market screening, and financial research tools.
The simple idea behind this library is to pull any data related to SIC number of any US stock market ticker provided by SEC in order to see the industry and also see the exact competitors of the ticker.
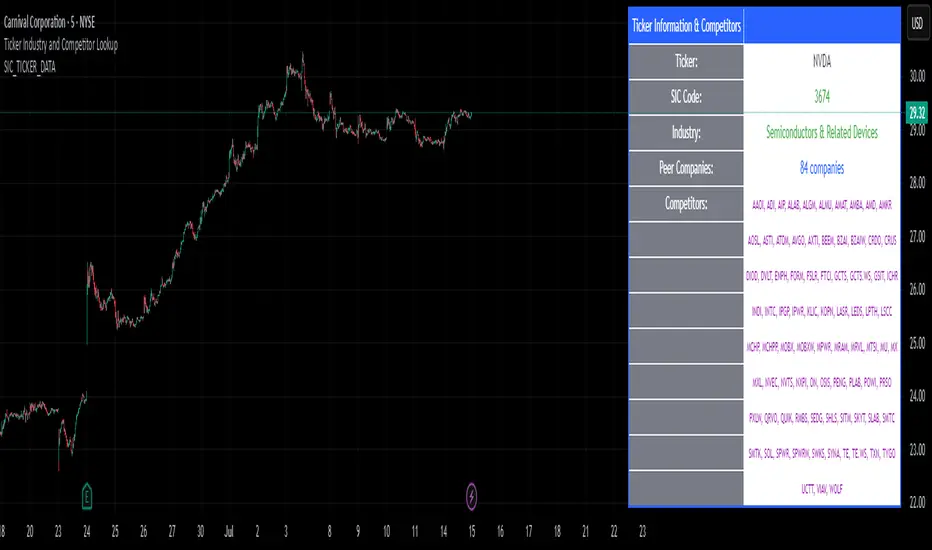
The library stores 3 types of data: SIC number, Ticker, and Industry name. What makes it very useful is that you can pull any one of this data using the other. For example, if you would like to know which tickers are inside a certain SIC, or what's the SIC number of a specific ticker, or even which tickers are inside a certain industry, you can use this library to pull this data. The idea for data inside this library is to be accessible in any direction possible as long as they're related to each other.
We've also published a simple indicator that uses this library in order to demonstrate the inner workings of this library.
The library stores thousands of tickers and their relevant SIC code and industry for your use and is constantly updated with new data when available. This is a large library but it is optimized to run as fast as possible. The previous unpublished versions would take over 40 seconds to load any data but the final public version here loads the data in less than 5 seconds.
🔍 Primary Lookup Functions
createDataStore()
Initialize the library with all pre-loaded data.
Pine Script®
getSicByTicker(store, ticker)
Get SIC code for any ticker symbol.
Pine Script®
getIndustryByTicker(store, ticker)
Get industry classification for any ticker.
Pine Script®
getTickersBySic(store, sic)
Get all companies in a specific SIC code.
Pine Script®
getTickersByIndustry(store, industry)
Get all companies in an industry.
Pine Script®
📊 Array & Analysis Functions
getTickerArrayBySic(store, sic)
Get tickers as array for processing.
Pine Script®
getTickerCountBySic(store, sic)
Count companies in a sector (ultra-fast).
Pine Script®
🎯 Utility Functions
tickerExists(store, ticker)
Check if ticker exists in database.
Pine Script®
tickerInSic(store, ticker, sic)
Check if ticker belongs to specific sector.
Pine Script®
💡 Usage Examples
Example 1: Basic Ticker Lookup
Pine Script®
Example 2: Sector Analysis
// version=6
import EdgeTerminal/SIC_TICKER_DATA/1 as data
indicator("Sector Comparison", overlay=false)
store = data.createDataStore()
// Compare sector sizes
techCount = data.getTickerCountBySic(store, "7372") // Software
financeCount = data.getTickerCountBySic(store, "6199") // Finance
healthCount = data.getTickerCountBySic(store, "2834") // Pharmaceutical
plot(techCount, title="Tech Companies", color=color.blue)
plot(financeCount, title="Finance Companies", color=color.green)
plot(healthCount, title="Health Companies", color=color.red)
Example 3: Peer Analysis
Pine Script®
Example 4: Portfolio Sector Allocation
Pine Script®
🔧 Advanced Feature
You can also bulk load data for large data sets like this:
Pine Script®
Perfect for: Sector rotation strategies, peer analysis, portfolio diversification, market screening, and financial research tools.
The simple idea behind this library is to pull any data related to SIC number of any US stock market ticker provided by SEC in order to see the industry and also see the exact competitors of the ticker.
The library stores 3 types of data: SIC number, Ticker, and Industry name. What makes it very useful is that you can pull any one of this data using the other. For example, if you would like to know which tickers are inside a certain SIC, or what's the SIC number of a specific ticker, or even which tickers are inside a certain industry, you can use this library to pull this data. The idea for data inside this library is to be accessible in any direction possible as long as they're related to each other.
We've also published a simple indicator that uses this library in order to demonstrate the inner workings of this library.
The library stores thousands of tickers and their relevant SIC code and industry for your use and is constantly updated with new data when available. This is a large library but it is optimized to run as fast as possible. The previous unpublished versions would take over 40 seconds to load any data but the final public version here loads the data in less than 5 seconds.
🔍 Primary Lookup Functions
createDataStore()
Initialize the library with all pre-loaded data.
store = data.createDataStore()
getSicByTicker(store, ticker)
Get SIC code for any ticker symbol.
sic = data.getSicByTicker(store, "AAPL") // Returns: "3571"
getIndustryByTicker(store, ticker)
Get industry classification for any ticker.
industry = data.getIndustryByTicker(store, "AAPL") // Returns: "Computer Hardware"
getTickersBySic(store, sic)
Get all companies in a specific SIC code.
software = data.getTickersBySic(store, "7372") // Returns: "MSFT,GOOGL,META,V,MA,CRM,ADBE,ORCL,NOW,INTU"
getTickersByIndustry(store, industry)
Get all companies in an industry.
retail = data.getTickersByIndustry(store, "Retail") // Returns: "AMZN,HD,WMT,TGT,COST,LOW"
📊 Array & Analysis Functions
getTickerArrayBySic(store, sic)
Get tickers as array for processing.
techArray = data.getTickerArrayBySic(store, "7372")
for i = 0 to array.size(techArray) - 1
ticker = array.get(techArray, i)
// Process each tech company
getTickerCountBySic(store, sic)
Count companies in a sector (ultra-fast).
pinescripttechCount = data.getTickerCountBySic(store, "7372") // Returns: 10
🎯 Utility Functions
tickerExists(store, ticker)
Check if ticker exists in database.
exists = data.tickerExists(store, "AAPL") // Returns: true
tickerInSic(store, ticker, sic)
Check if ticker belongs to specific sector.
isInTech = data.tickerInSic(store, "AAPL", "3571") // Returns: true
💡 Usage Examples
Example 1: Basic Ticker Lookup
// @version=6
import EdgeTerminal/SIC_TICKER_DATA/1 as data
indicator("Ticker Analysis", overlay=true)
store = data.createDataStore()
currentSic = data.getSicByTicker(store, syminfo.ticker)
currentIndustry = data.getIndustryByTicker(store, syminfo.ticker)
if barstate.islast and currentSic != "NOT_FOUND"
label.new(bar_index, high, syminfo.ticker + "\nSIC: " + currentSic + "\nIndustry: " + currentIndustry)
Example 2: Sector Analysis
// version=6
import EdgeTerminal/SIC_TICKER_DATA/1 as data
indicator("Sector Comparison", overlay=false)
store = data.createDataStore()
// Compare sector sizes
techCount = data.getTickerCountBySic(store, "7372") // Software
financeCount = data.getTickerCountBySic(store, "6199") // Finance
healthCount = data.getTickerCountBySic(store, "2834") // Pharmaceutical
plot(techCount, title="Tech Companies", color=color.blue)
plot(financeCount, title="Finance Companies", color=color.green)
plot(healthCount, title="Health Companies", color=color.red)
Example 3: Peer Analysis
// @version=6
import EdgeTerminal/SIC_TICKER_DATA/1 as data
indicator("Find Competitors", overlay=true)
store = data.createDataStore()
currentSic = data.getSicByTicker(store, syminfo.ticker)
if currentSic != "NOT_FOUND"
competitors = data.getTickersBySic(store, currentSic)
peerCount = data.getTickerCountBySic(store, currentSic)
if barstate.islast
label.new(bar_index, high, "Competitors (" + str.tostring(peerCount) + "):\n" + competitors)
Example 4: Portfolio Sector Allocation
// @version=6
import EdgeTerminal/SIC_TICKER_DATA/1 as data
indicator("Portfolio Analysis", overlay=false)
store = data.createDataStore()
// Analyze your portfolio's sector distribution
portfolioTickers = array.from("AAPL", "MSFT", "GOOGL", "JPM", "JNJ")
sectorCount = map.new<string, int>()
for i = 0 to array.size(portfolioTickers) - 1
ticker = array.get(portfolioTickers, i)
industry = data.getIndustryByTicker(store, ticker)
if industry != "NOT_FOUND"
currentCount = map.get(sectorCount, industry)
newCount = na(currentCount) ? 1 : currentCount + 1
map.put(sectorCount, industry, newCount)
🔧 Advanced Feature
You can also bulk load data for large data sets like this:
// Pre-format your data as pipe-separated string
bulkData = "AAPL:3571:Computer Hardware|MSFT:7372:Software|GOOGL:7372:Software"
store = data.createDataStoreFromBulk(bulkData)
파인 라이브러리
트레이딩뷰의 진정한 정신에 따라, 작성자는 이 파인 코드를 오픈소스 라이브러리로 게시하여 커뮤니티의 다른 파인 프로그래머들이 재사용할 수 있도록 했습니다. 작성자에게 경의를 표합니다! 이 라이브러리는 개인적으로 사용하거나 다른 오픈소스 게시물에서 사용할 수 있지만, 이 코드의 게시물 내 재사용은 하우스 룰에 따라 규제됩니다.
Indicators: etlnk.co/indicators
YouTube: youtube.com/@edgeterminal/
YouTube: youtube.com/@edgeterminal/
면책사항
해당 정보와 게시물은 금융, 투자, 트레이딩 또는 기타 유형의 조언이나 권장 사항으로 간주되지 않으며, 트레이딩뷰에서 제공하거나 보증하는 것이 아닙니다. 자세한 내용은 이용 약관을 참조하세요.