OPEN-SOURCE SCRIPT
업데이트됨 Hi-Lo-Gauges
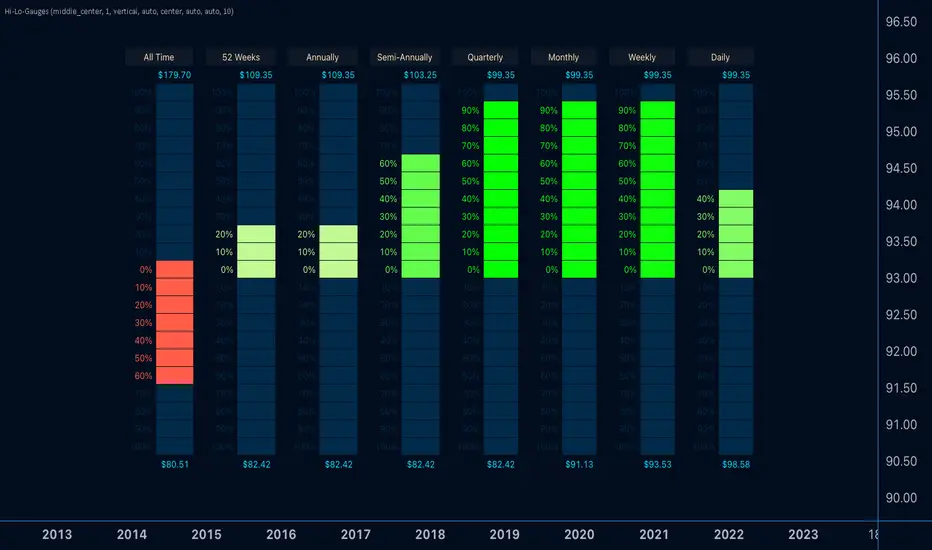
Introducing the 'Hi-Lo-Gauges' indicator, a powerful tool designed to provide a comprehensive visual representation of key price metrics. This indicator leverages up to 8 preset gauges, each catering to a specific aspect of market data:
Users have the flexibility to choose all 8 or selectively display specific gauges. For each metric, the gauge dynamically adapts, with the low value set as the minimum and the high value as the maximum. Measurement options include utilizing the highest and lowest closes or the literal highest and lowest prices.
The active price of the underlying asset serves as the reference point, allowing users to gauge the percentage move on the scale between the chosen minimum and maximum. Complete customization is at the users' fingertips, enabling them to tailor the indicator's appearance to suit their preferences.
With 'Hi-Lo-Gauges,' traders and analysts can intuitively monitor and interpret diverse price metrics, fostering a deeper understanding of market dynamics and supporting more informed decision-making.
Note: 'Hi-Lo-Gauges' is visible and applicable exclusively on the daily timeframe due to the nature of the metrics used.
- All-time high and low
- Current 52 Weeks high and low
- Current Annual High and Low
- Current Semi-Annual High and Low
- Current Quarterly High and Low
- Current Monthly High and Low
- Current Weekly High and Low
- Current Daily High and Low
Users have the flexibility to choose all 8 or selectively display specific gauges. For each metric, the gauge dynamically adapts, with the low value set as the minimum and the high value as the maximum. Measurement options include utilizing the highest and lowest closes or the literal highest and lowest prices.
The active price of the underlying asset serves as the reference point, allowing users to gauge the percentage move on the scale between the chosen minimum and maximum. Complete customization is at the users' fingertips, enabling them to tailor the indicator's appearance to suit their preferences.
With 'Hi-Lo-Gauges,' traders and analysts can intuitively monitor and interpret diverse price metrics, fostering a deeper understanding of market dynamics and supporting more informed decision-making.
Note: 'Hi-Lo-Gauges' is visible and applicable exclusively on the daily timeframe due to the nature of the metrics used.
릴리즈 노트
Bug:The weekly calculation was causing NaN value when reached Sunday. Solved: Issue resolved with correct calculation of milliseconds.
릴리즈 노트
Versions updated for imported libraries, and minor formatting fix.릴리즈 노트
Indicator visibility updated to timeframes daily and above. 릴리즈 노트
Updated: Imported libraries version update오픈 소스 스크립트
트레이딩뷰의 진정한 정신에 따라, 이 스크립트의 작성자는 이를 오픈소스로 공개하여 트레이더들이 기능을 검토하고 검증할 수 있도록 했습니다. 작성자에게 찬사를 보냅니다! 이 코드는 무료로 사용할 수 있지만, 코드를 재게시하는 경우 하우스 룰이 적용된다는 점을 기억하세요.
Faiyaz Haider
면책사항
해당 정보와 게시물은 금융, 투자, 트레이딩 또는 기타 유형의 조언이나 권장 사항으로 간주되지 않으며, 트레이딩뷰에서 제공하거나 보증하는 것이 아닙니다. 자세한 내용은 이용 약관을 참조하세요.
오픈 소스 스크립트
트레이딩뷰의 진정한 정신에 따라, 이 스크립트의 작성자는 이를 오픈소스로 공개하여 트레이더들이 기능을 검토하고 검증할 수 있도록 했습니다. 작성자에게 찬사를 보냅니다! 이 코드는 무료로 사용할 수 있지만, 코드를 재게시하는 경우 하우스 룰이 적용된다는 점을 기억하세요.
Faiyaz Haider
면책사항
해당 정보와 게시물은 금융, 투자, 트레이딩 또는 기타 유형의 조언이나 권장 사항으로 간주되지 않으며, 트레이딩뷰에서 제공하거나 보증하는 것이 아닙니다. 자세한 내용은 이용 약관을 참조하세요.