OPEN-SOURCE SCRIPT
Z-Score
The "Z-Score" indicator is a unique and powerful tool designed to help traders identify overbought and oversold conditions in the market. Below is an explanation of its features, usefulness, and what makes it special:
Features:
Z-Score Calculation: The indicator calculates the Z-Score, a statistical measure that represents how far the current price is from the moving average (MA) in terms of standard deviations. It helps identify extreme price movements.
Customizable Parameters: Traders can adjust key parameters such as the Z-Score threshold, the type of MA (e.g., SMA, EMA), and the length of the moving average to suit their trading preferences.
Signal Options: The indicator offers flexibility in terms of signaling. Traders can choose whether to trigger signals when the Z-Score crosses the specified threshold or when it moves away from the threshold.
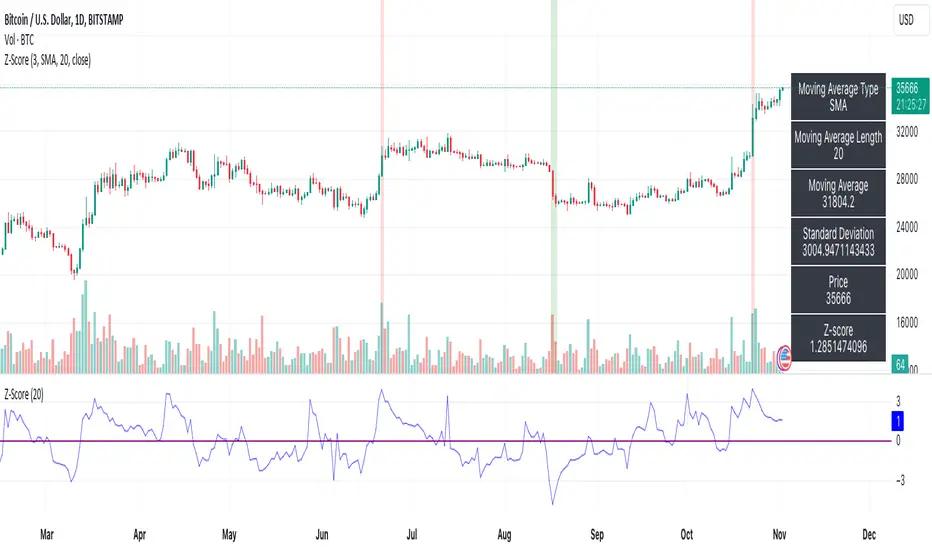
Visual Signals: Z-Score conditions are represented visually on the chart with color-coded background highlights. Overbought conditions are marked with a red background, while oversold conditions are indicated with a green background.
Information Table: A dynamic information table displays essential details, including the MA type, MA length, MA value, standard deviation, current price, and Z-Score. This information table helps traders make informed decisions.
Usefulness:
Overbought and Oversold Signals: Z-Score is particularly valuable for identifying overbought and oversold market conditions. Traders can use this information to potentially enter or exit positions.
Statistical Analysis: The Z-Score provides a statistical measure of price deviation, offering a data-driven approach to market analysis.
Customization: Traders can customize the indicator to match their trading strategies and preferences, enhancing its adaptability to different trading styles.
Visual Clarity: The visual signals make it easy for traders to quickly spot potential trade opportunities on the price chart.
In summary, the Z-Score indicator is a valuable tool for traders looking to incorporate statistical analysis into their trading strategies. Its customizability, visual signals, and unique statistical approach make it an exceptional choice for identifying overbought and oversold market conditions and potential trading opportunities.
Features:
Z-Score Calculation: The indicator calculates the Z-Score, a statistical measure that represents how far the current price is from the moving average (MA) in terms of standard deviations. It helps identify extreme price movements.
Customizable Parameters: Traders can adjust key parameters such as the Z-Score threshold, the type of MA (e.g., SMA, EMA), and the length of the moving average to suit their trading preferences.
Signal Options: The indicator offers flexibility in terms of signaling. Traders can choose whether to trigger signals when the Z-Score crosses the specified threshold or when it moves away from the threshold.
Visual Signals: Z-Score conditions are represented visually on the chart with color-coded background highlights. Overbought conditions are marked with a red background, while oversold conditions are indicated with a green background.
Information Table: A dynamic information table displays essential details, including the MA type, MA length, MA value, standard deviation, current price, and Z-Score. This information table helps traders make informed decisions.
Usefulness:
Overbought and Oversold Signals: Z-Score is particularly valuable for identifying overbought and oversold market conditions. Traders can use this information to potentially enter or exit positions.
Statistical Analysis: The Z-Score provides a statistical measure of price deviation, offering a data-driven approach to market analysis.
Customization: Traders can customize the indicator to match their trading strategies and preferences, enhancing its adaptability to different trading styles.
Visual Clarity: The visual signals make it easy for traders to quickly spot potential trade opportunities on the price chart.
In summary, the Z-Score indicator is a valuable tool for traders looking to incorporate statistical analysis into their trading strategies. Its customizability, visual signals, and unique statistical approach make it an exceptional choice for identifying overbought and oversold market conditions and potential trading opportunities.
오픈 소스 스크립트
트레이딩뷰의 진정한 정신에 따라, 이 스크립트의 작성자는 이를 오픈소스로 공개하여 트레이더들이 기능을 검토하고 검증할 수 있도록 했습니다. 작성자에게 찬사를 보냅니다! 이 코드는 무료로 사용할 수 있지만, 코드를 재게시하는 경우 하우스 룰이 적용된다는 점을 기억하세요.
면책사항
해당 정보와 게시물은 금융, 투자, 트레이딩 또는 기타 유형의 조언이나 권장 사항으로 간주되지 않으며, 트레이딩뷰에서 제공하거나 보증하는 것이 아닙니다. 자세한 내용은 이용 약관을 참조하세요.
오픈 소스 스크립트
트레이딩뷰의 진정한 정신에 따라, 이 스크립트의 작성자는 이를 오픈소스로 공개하여 트레이더들이 기능을 검토하고 검증할 수 있도록 했습니다. 작성자에게 찬사를 보냅니다! 이 코드는 무료로 사용할 수 있지만, 코드를 재게시하는 경우 하우스 룰이 적용된다는 점을 기억하세요.
면책사항
해당 정보와 게시물은 금융, 투자, 트레이딩 또는 기타 유형의 조언이나 권장 사항으로 간주되지 않으며, 트레이딩뷰에서 제공하거나 보증하는 것이 아닙니다. 자세한 내용은 이용 약관을 참조하세요.