OPEN-SOURCE SCRIPT
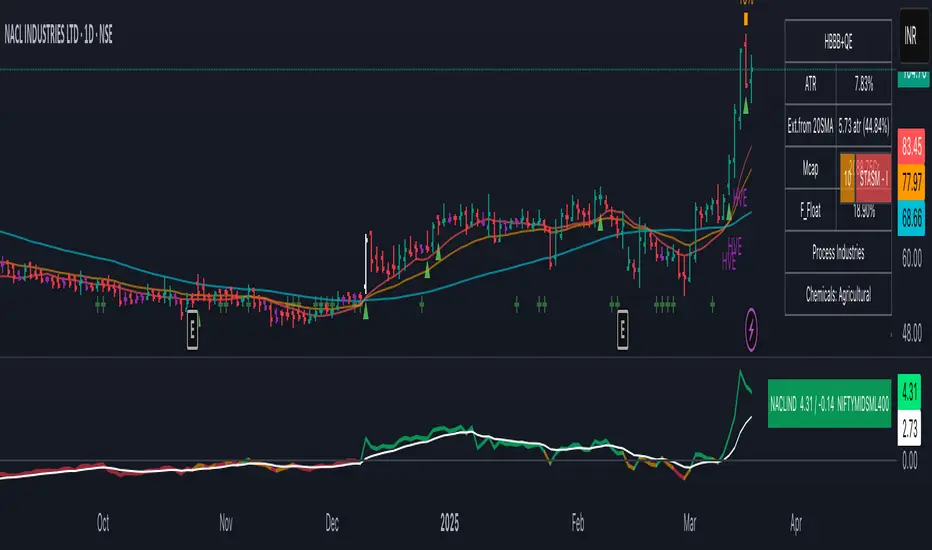
Mswing Homma

The Mswing is a momentum oscillator that calculates the rate of price change over 20 and 50 periods (days/weeks). Apart from quantifying momentum, it can be used for assessing relative strength, sectoral rotation & entry/exit signals.
Quantifying Momentum Strength
The Mswing's relationship with its EMA (e.g., 5-period or 9-period) is used for momentum analysis:
• M Swing >0 and Above EMA: Momentum is positive and accelerating (ideal for entries).
• M Swing >0 and Below EMA: Momentum is positive but decelerating (caution).
• M Swing <0 and Above EMA: Momentum is negative but improving (watch for reversals).
• M Swing <0 and Below EMA: Momentum is negative and worsening (exit or avoid).
Relative Strength Scanning (M Score)
Sort stocks by their M Swing using TradingView’s Pine scanner.
Compare the Mswing scores of indices/sectors to allocate capital to stronger groups (e.g., renewables vs. traditional energy).
Stocks with strong Mswing scores tend to outperform during bullish phases, while weak ones collapse faster in downtrends.
Entry and Exit Signals
Entry: Buy when Mswing crosses above 0 + price breaks key moving averages (50-day SMA). Use Mswing >0 to confirm valid breakouts. Buy dips when Mswing holds above EMA during retracements.
Exit: Mswing can be used for exiting a stock in 2 ways:
• Sell in Strength: Mswing >4 (overbought).
• Sell in Weakness: Mswing <0 + price below 50-day SMA.
Multi-Timeframe Analysis
• Daily: For swing trades.
• Weekly: For trend confirmation.
• Monthly: For long-term portfolio adjustments.
오픈 소스 스크립트
트레이딩뷰의 진정한 정신에 따라, 이 스크립트의 작성자는 이를 오픈소스로 공개하여 트레이더들이 기능을 검토하고 검증할 수 있도록 했습니다. 작성자에게 찬사를 보냅니다! 이 코드는 무료로 사용할 수 있지만, 코드를 재게시하는 경우 하우스 룰이 적용된다는 점을 기억하세요.
면책사항
해당 정보와 게시물은 금융, 투자, 트레이딩 또는 기타 유형의 조언이나 권장 사항으로 간주되지 않으며, 트레이딩뷰에서 제공하거나 보증하는 것이 아닙니다. 자세한 내용은 이용 약관을 참조하세요.
오픈 소스 스크립트
트레이딩뷰의 진정한 정신에 따라, 이 스크립트의 작성자는 이를 오픈소스로 공개하여 트레이더들이 기능을 검토하고 검증할 수 있도록 했습니다. 작성자에게 찬사를 보냅니다! 이 코드는 무료로 사용할 수 있지만, 코드를 재게시하는 경우 하우스 룰이 적용된다는 점을 기억하세요.
면책사항
해당 정보와 게시물은 금융, 투자, 트레이딩 또는 기타 유형의 조언이나 권장 사항으로 간주되지 않으며, 트레이딩뷰에서 제공하거나 보증하는 것이 아닙니다. 자세한 내용은 이용 약관을 참조하세요.