PROTECTED SOURCE SCRIPT
Daily SMA200 Distance - Percentile Zones
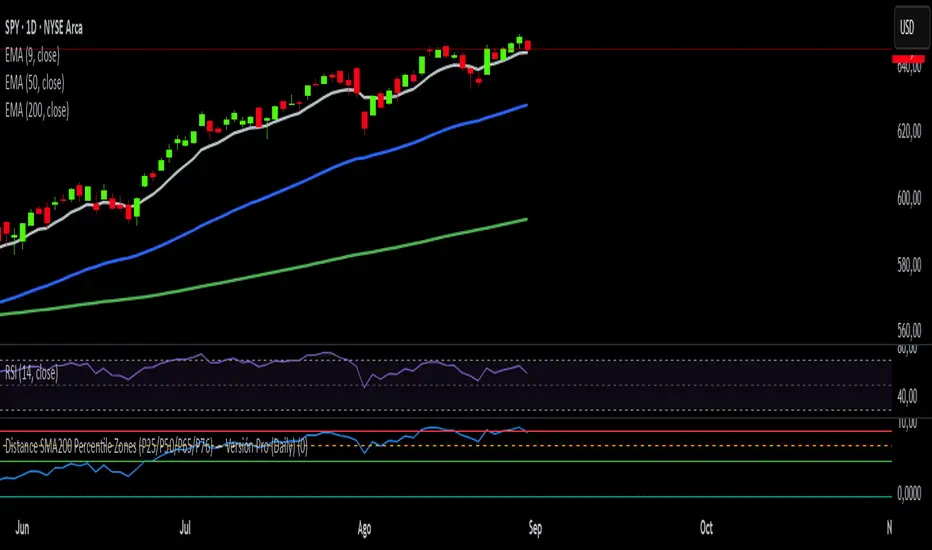
The Daily SMA200 Distance – Percentile Zones indicator measures the percentage distance of price relative to the 200-day Simple Moving Average (SMA200) and classifies it into historical percentile zones.
This tool helps identify the context of an asset in relation to its medium- to long-term trend:
Cheap Zone (< P25): price at historically low levels relative to the SMA200.
Value Zone (P25–P50): neutral range, where price trades around its medium-term average.
Acceptable Zone (P50–P65): moderately high levels, still reasonable within an uptrend.
Not Recommended Zone (P65–P76): overextended territory with rising correction risk.
Very Expensive Zone (≥ P76): extreme levels, historically linked to overvaluation and potential market tops.
Percentile calculations update dynamically with each new daily candle, providing a robust and objective statistical perspective for swing trading and portfolio management decisions.
보호된 스크립트입니다
이 스크립트는 비공개 소스로 게시됩니다. 하지만 제한 없이 자유롭게 사용할 수 있습니다 — 여기에서 자세히 알아보기.
면책사항
이 정보와 게시물은 TradingView에서 제공하거나 보증하는 금융, 투자, 거래 또는 기타 유형의 조언이나 권고 사항을 의미하거나 구성하지 않습니다. 자세한 내용은 이용 약관을 참고하세요.
보호된 스크립트입니다
이 스크립트는 비공개 소스로 게시됩니다. 하지만 제한 없이 자유롭게 사용할 수 있습니다 — 여기에서 자세히 알아보기.
면책사항
이 정보와 게시물은 TradingView에서 제공하거나 보증하는 금융, 투자, 거래 또는 기타 유형의 조언이나 권고 사항을 의미하거나 구성하지 않습니다. 자세한 내용은 이용 약관을 참고하세요.