OPEN-SOURCE SCRIPT
Candle Strength based on Relative Strength of EMA
Overview:
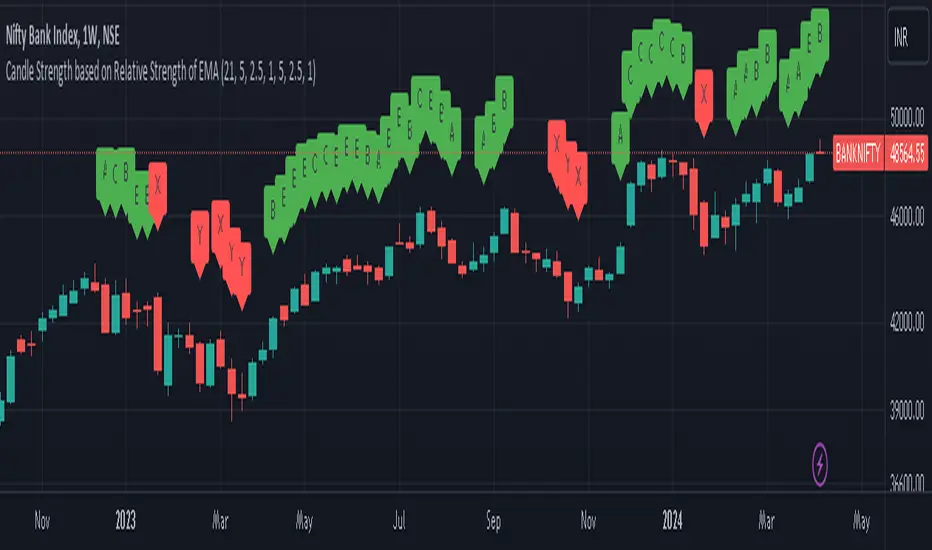
The EMA-Based Relative Strength Labels indicator provides a dynamic method to visualize the strength of price movements relative to an Exponential Moving Average (EMA). By comparing the current price to the EMA, it assigns labels (A, B, C for bullish and X, Y, Z for bearish) to candles, indicating the intensity of bullish or bearish behavior.
Key Features:
Dynamic EMA Comparison: The indicator calculates the difference between the current price and the EMA, expressing it as a percentage to determine relative strength.
Configurable Thresholds: Users can set custom thresholds for strong, moderate, and low bullish or bearish movements, allowing for tailored analysis based on personal trading strategy or market behavior.
Clear Visual Labels: Each candle is labeled directly on the chart, making it easy to spot significant price movements at a glance.
Usage:
Trend Confirmation: The labels help confirm the prevailing trend's strength, aiding traders in decision-making regarding entry or exit points.
Risk Management: By identifying the strength of the price movements, traders can better manage stop-loss placements and avoid potential false breakouts.
Strategy Development: Incorporate the indicator into trading systems to enhance strategies that depend on trend strength and momentum.
How It Works:
The script calculates the EMA of the closing prices and measures the relative strength of each candle to this average.
Bullish candles above the EMA and bearish candles below the EMA are further analyzed to determine their strength based on predefined percentage thresholds.
Labels 'A', 'B', and 'C' are assigned for varying degrees of bullish strength, while 'X', 'Y', and 'Z' denote levels of bearish intensity.
Customization:
Users can adjust the EMA period and modify the strength thresholds for both bullish and bearish conditions to suit different instruments and timeframes.
Best Practices:
Combine this indicator with volume analysis and other technical tools for comprehensive market analysis.
Regularly update the thresholds based on market volatility and personal risk tolerance to maintain the effectiveness of the labels.
오픈 소스 스크립트
트레이딩뷰의 진정한 정신에 따라, 이 스크립트의 작성자는 이를 오픈소스로 공개하여 트레이더들이 기능을 검토하고 검증할 수 있도록 했습니다. 작성자에게 찬사를 보냅니다! 이 코드는 무료로 사용할 수 있지만, 코드를 재게시하는 경우 하우스 룰이 적용된다는 점을 기억하세요.
면책사항
해당 정보와 게시물은 금융, 투자, 트레이딩 또는 기타 유형의 조언이나 권장 사항으로 간주되지 않으며, 트레이딩뷰에서 제공하거나 보증하는 것이 아닙니다. 자세한 내용은 이용 약관을 참조하세요.
오픈 소스 스크립트
트레이딩뷰의 진정한 정신에 따라, 이 스크립트의 작성자는 이를 오픈소스로 공개하여 트레이더들이 기능을 검토하고 검증할 수 있도록 했습니다. 작성자에게 찬사를 보냅니다! 이 코드는 무료로 사용할 수 있지만, 코드를 재게시하는 경우 하우스 룰이 적용된다는 점을 기억하세요.
면책사항
해당 정보와 게시물은 금융, 투자, 트레이딩 또는 기타 유형의 조언이나 권장 사항으로 간주되지 않으며, 트레이딩뷰에서 제공하거나 보증하는 것이 아닙니다. 자세한 내용은 이용 약관을 참조하세요.