OPEN-SOURCE SCRIPT
Strong Levels (Safe Version)
Strong Levels (Safe Version)
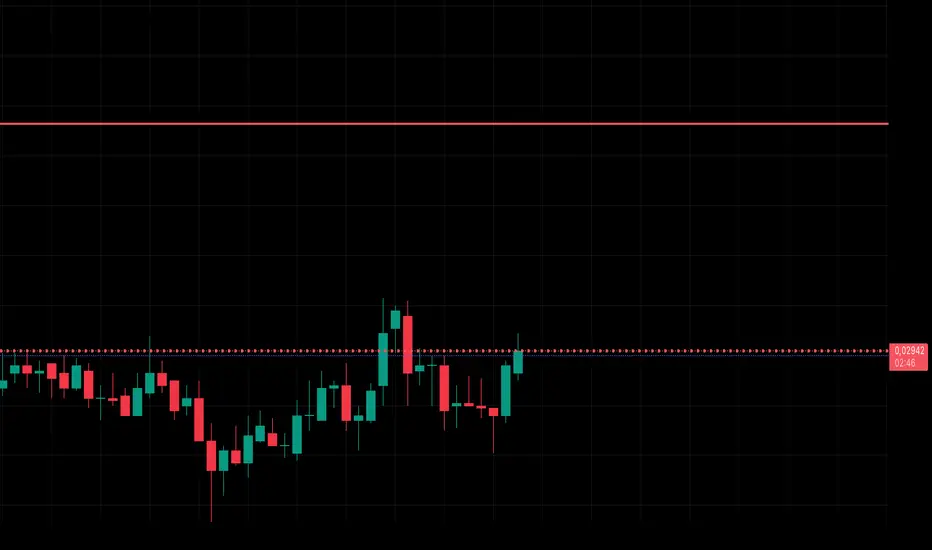
This indicator automatically detects and plots strong support and resistance levels based on pivot highs/lows and the number of touches. It’s designed to highlight only the most reliable levels by filtering with ATR tolerance and minimum touch requirements.
Features:
Detects pivot-based support and resistance zones
Adjustable left/right candles for pivot sensitivity
Minimum touches filter to confirm significant levels
ATR-based tolerance for flexible clustering of nearby levels
Maximum levels limit for cleaner charts
Automatic color coding (teal = support, red = resistance)
Safe version with optimized handling of line objects (up to 500 lines)
Parameters:
Left / Right candles – sensitivity of pivot detection
Min. touches – minimum confirmations required to display a level
ATR period & multiplier – tolerance range for grouping nearby levels
Max levels – limits the number of active levels
Colors – customize support and resistance lines
Usage:
This tool helps traders quickly identify the strongest price levels where market reactions are most likely. Use it to find high-probability entry, exit, or stop-loss zones in any market and timeframe.
오픈 소스 스크립트
진정한 트레이딩뷰 정신에 따라 이 스크립트 작성자는 트레이더가 기능을 검토하고 검증할 수 있도록 오픈소스로 공개했습니다. 작성자에게 찬사를 보냅니다! 무료로 사용할 수 있지만 코드를 다시 게시할 경우 하우스 룰이 적용된다는 점을 기억하세요.
면책사항
이 정보와 게시물은 TradingView에서 제공하거나 보증하는 금융, 투자, 거래 또는 기타 유형의 조언이나 권고 사항을 의미하거나 구성하지 않습니다. 자세한 내용은 이용 약관을 참고하세요.
오픈 소스 스크립트
진정한 트레이딩뷰 정신에 따라 이 스크립트 작성자는 트레이더가 기능을 검토하고 검증할 수 있도록 오픈소스로 공개했습니다. 작성자에게 찬사를 보냅니다! 무료로 사용할 수 있지만 코드를 다시 게시할 경우 하우스 룰이 적용된다는 점을 기억하세요.
면책사항
이 정보와 게시물은 TradingView에서 제공하거나 보증하는 금융, 투자, 거래 또는 기타 유형의 조언이나 권고 사항을 의미하거나 구성하지 않습니다. 자세한 내용은 이용 약관을 참고하세요.