OPEN-SOURCE SCRIPT
업데이트됨 Market Snapshot
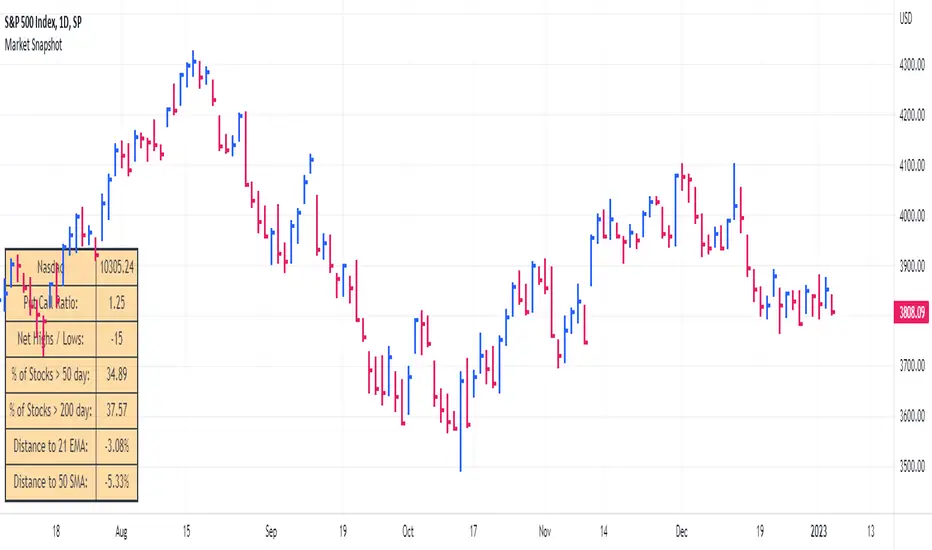
Get a snapshot of the market with the index's last price, distance to selectable moving averages, and breadth data.
Choose to see data based on the Nasdaq or SPX, as well as net highs / lows for the Nasdaq, NYSE or combined.
Snapshot shows:
- Index's (SPX or Nasdaq's) last price
- Put call ratio
- % of stocks above the 50 day moving average for the index of your choice
- % of stocks above the 200 day moving average for the index of your choice
- Distance to or from two selectable moving averages. (negative number means price is below the moving average, positive means price is above)
Configurable options:
- Which moving averages to use
- Where to display the table on your chart
- Table size, background and text colors
릴리즈 노트
fixed table sizing 릴리즈 노트
bug fix오픈 소스 스크립트
트레이딩뷰의 진정한 정신에 따라, 이 스크립트의 작성자는 이를 오픈소스로 공개하여 트레이더들이 기능을 검토하고 검증할 수 있도록 했습니다. 작성자에게 찬사를 보냅니다! 이 코드는 무료로 사용할 수 있지만, 코드를 재게시하는 경우 하우스 룰이 적용된다는 점을 기억하세요.
Trusted Pine programmer. Send me a message for script development.
면책사항
해당 정보와 게시물은 금융, 투자, 트레이딩 또는 기타 유형의 조언이나 권장 사항으로 간주되지 않으며, 트레이딩뷰에서 제공하거나 보증하는 것이 아닙니다. 자세한 내용은 이용 약관을 참조하세요.
오픈 소스 스크립트
트레이딩뷰의 진정한 정신에 따라, 이 스크립트의 작성자는 이를 오픈소스로 공개하여 트레이더들이 기능을 검토하고 검증할 수 있도록 했습니다. 작성자에게 찬사를 보냅니다! 이 코드는 무료로 사용할 수 있지만, 코드를 재게시하는 경우 하우스 룰이 적용된다는 점을 기억하세요.
Trusted Pine programmer. Send me a message for script development.
면책사항
해당 정보와 게시물은 금융, 투자, 트레이딩 또는 기타 유형의 조언이나 권장 사항으로 간주되지 않으며, 트레이딩뷰에서 제공하거나 보증하는 것이 아닙니다. 자세한 내용은 이용 약관을 참조하세요.