OPEN-SOURCE SCRIPT
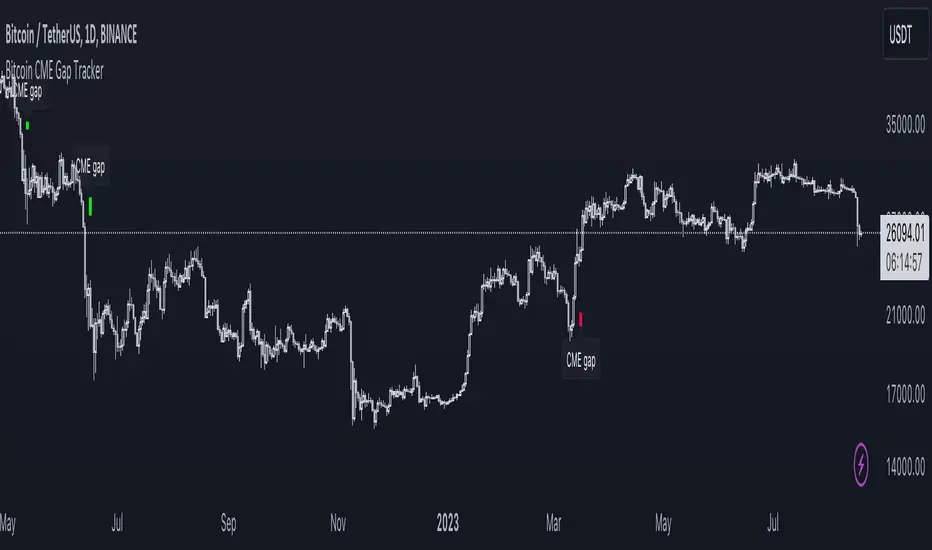
Bitcoin CME Gap Tracker

CME Bitcoin Futures Gaps: What Are They and Why Are They Important?
Gaps are breaks between price candles on charts, illustrating the intervals between the closing price of the previous period and the opening price of the next. For Bitcoin on CME, these gaps arise due to the particular workings of this market.
Bitcoin and other cryptocurrencies trade 24/7 without breaks. However, CME Bitcoin Futures, like many other financial instruments on traditional exchanges, have weekends and trading pauses. When the Bitcoin market continues to move during weekends or CME closures, and then CME opens on the subsequent trading day, a price disparity can occur, perceived as a gap.
Several studies suggest that in most cases (approximately 70% and more), the market reverts to "close" these gaps. This phenomenon is observed because large liquidity is concentrated at these gap points. There are many unfilled orders in gap zones, placed at specific prices. When the price reaches these levels, it can swiftly react to this "clustering" of orders, potentially leading to the gap's closure.
Therefore, CME Bitcoin Futures gaps not only reflect crucial psychological moments in the market but can also serve as potential entry or exit points, considering the high liquidity in these zones.
Technical Description:
The script is designed to identify gaps in the Bitcoin Futures chart on CME. It automatically detects gaps that appear on Mondays (since CME is closed on weekends) and are larger than the user-specified percentage.
Key Features:
User Guide:
Gaps are breaks between price candles on charts, illustrating the intervals between the closing price of the previous period and the opening price of the next. For Bitcoin on CME, these gaps arise due to the particular workings of this market.
Bitcoin and other cryptocurrencies trade 24/7 without breaks. However, CME Bitcoin Futures, like many other financial instruments on traditional exchanges, have weekends and trading pauses. When the Bitcoin market continues to move during weekends or CME closures, and then CME opens on the subsequent trading day, a price disparity can occur, perceived as a gap.
Several studies suggest that in most cases (approximately 70% and more), the market reverts to "close" these gaps. This phenomenon is observed because large liquidity is concentrated at these gap points. There are many unfilled orders in gap zones, placed at specific prices. When the price reaches these levels, it can swiftly react to this "clustering" of orders, potentially leading to the gap's closure.
Therefore, CME Bitcoin Futures gaps not only reflect crucial psychological moments in the market but can also serve as potential entry or exit points, considering the high liquidity in these zones.
Technical Description:
The script is designed to identify gaps in the Bitcoin Futures chart on CME. It automatically detects gaps that appear on Mondays (since CME is closed on weekends) and are larger than the user-specified percentage.
Key Features:
- Identification of the weekday to detect gaps that arose on Monday.
- Calculation of positive and negative gaps by comparing the highs and lows of the previous candles with the current ones.
- Graphical representation of the gaps using lines and labels on the chart.
User Guide:
- Add this script to your TradingView chart.
- You can adjust the "Show gaps larger than %" parameter to determine the minimum gap size of interest.
- Gaps will be automatically displayed on your chart with lines and labels.
오픈 소스 스크립트
트레이딩뷰의 진정한 정신에 따라, 이 스크립트의 작성자는 이를 오픈소스로 공개하여 트레이더들이 기능을 검토하고 검증할 수 있도록 했습니다. 작성자에게 찬사를 보냅니다! 이 코드는 무료로 사용할 수 있지만, 코드를 재게시하는 경우 하우스 룰이 적용된다는 점을 기억하세요.
Private community with my recommendations 👉 [ bit.ly/bs-alerts ]
Asset Management 👉 [ bit.ly/assetmn ]
Asset Management 👉 [ bit.ly/assetmn ]
면책사항
해당 정보와 게시물은 금융, 투자, 트레이딩 또는 기타 유형의 조언이나 권장 사항으로 간주되지 않으며, 트레이딩뷰에서 제공하거나 보증하는 것이 아닙니다. 자세한 내용은 이용 약관을 참조하세요.