PROTECTED SOURCE SCRIPT
업데이트됨 Dow Theory HH-HL-LH_LL 2025
https://www.tradingview.com/x/5NnYMiHx/
https://www.tradingview.com/x/jMCYXKjY/
https://www.tradingview.com/x/NBsdZbdA/
//--------------------------------------------
Dow Theory HH-HL-LH-LL 2025
//--------------------------------------------
✅ Purpose
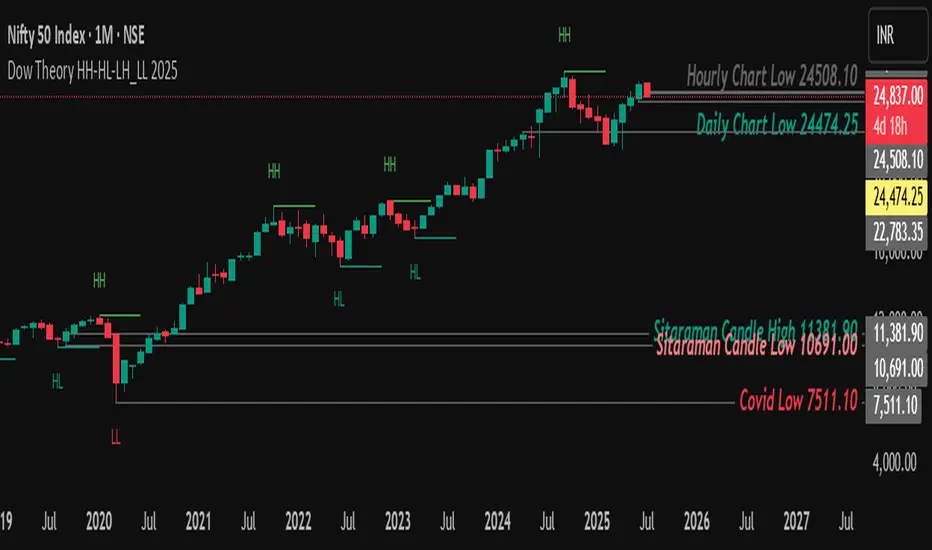
This indicator visualizes Dow Theory structure by identifying:
//--------------------------------------------
Higher Highs (HH)
Higher Lows (HL)
Lower Highs (LH)
Lower Lows (LL)
//--------------------------------------------
It helps traders clearly identify market trends, trend reversals, and structure shifts in real time —
crucial for both swing and intraday traders.
//--------------------------------------------
⚙️ Key Features & User Settings
//--------------------------------------------
🟩 1. New Day Highlight
Show_New_Day: Toggle ON/OFF background color for new trading days.
ND_Fill_Transp: Set transparency level of the day start background Color Box Line.
📏 2. Pivot Point Settings
Pivot_Period: Set the period used to detect pivot highs/lows Default is 5.
🎯 3. Line & Label Display
Show_Line: Show/hide support/resistance lines at HH, HL, LH, LL.
Show_Lbl: Show/hide text labels on chart.
Show_With_Price: Display price along with HH-HL-LH-LL labels.
🎨 4. Visual Themes
Select_Theme: Choose between 'Color' or 'Gray' for a colorful or minimal style.
✍️ 5. Support/Resistance Line Style
Line Width, Line Style: Customize thickness and style of lines.
Line Transparency: Set transparency of lines.
🏷️ 6. Label Text Styling
Lbl_Transp: Set background transparency for labels Default is 100 You can Change it any time to Show Label Background.
Txt_Transp: Set text transparency Default is 0 .
Txt_Size: Adjust label font size Default is 10.
🟡🟡🟡 And Best Thing of Indicator is you can Check Price any time Hovering on the Label - For Quick Referance 🟡🟡🟡
//--------------------------------------------
Trend Direction
//--------------------------------------------
🔹 Identify trend continuation or reversal zones.
🔹 Mark structure breakpoints to place stop losses.
🔹 Confirm signals from other indicators (RSI, EMA, VWAP, etc.).
🔹 Analyze price action with pure structure — no lagging indicators.
https://www.tradingview.com/x/jMCYXKjY/
https://www.tradingview.com/x/NBsdZbdA/
//--------------------------------------------
Dow Theory HH-HL-LH-LL 2025
//--------------------------------------------
✅ Purpose
This indicator visualizes Dow Theory structure by identifying:
//--------------------------------------------
Higher Highs (HH)
Higher Lows (HL)
Lower Highs (LH)
Lower Lows (LL)
//--------------------------------------------
It helps traders clearly identify market trends, trend reversals, and structure shifts in real time —
crucial for both swing and intraday traders.
//--------------------------------------------
⚙️ Key Features & User Settings
//--------------------------------------------
🟩 1. New Day Highlight
Show_New_Day: Toggle ON/OFF background color for new trading days.
ND_Fill_Transp: Set transparency level of the day start background Color Box Line.
📏 2. Pivot Point Settings
Pivot_Period: Set the period used to detect pivot highs/lows Default is 5.
🎯 3. Line & Label Display
Show_Line: Show/hide support/resistance lines at HH, HL, LH, LL.
Show_Lbl: Show/hide text labels on chart.
Show_With_Price: Display price along with HH-HL-LH-LL labels.
🎨 4. Visual Themes
Select_Theme: Choose between 'Color' or 'Gray' for a colorful or minimal style.
✍️ 5. Support/Resistance Line Style
Line Width, Line Style: Customize thickness and style of lines.
Line Transparency: Set transparency of lines.
🏷️ 6. Label Text Styling
Lbl_Transp: Set background transparency for labels Default is 100 You can Change it any time to Show Label Background.
Txt_Transp: Set text transparency Default is 0 .
Txt_Size: Adjust label font size Default is 10.
🟡🟡🟡 And Best Thing of Indicator is you can Check Price any time Hovering on the Label - For Quick Referance 🟡🟡🟡
//--------------------------------------------
Trend Direction
//--------------------------------------------
🔹 Identify trend continuation or reversal zones.
🔹 Mark structure breakpoints to place stop losses.
🔹 Confirm signals from other indicators (RSI, EMA, VWAP, etc.).
🔹 Analyze price action with pure structure — no lagging indicators.
릴리즈 노트
//--------------------------------------------
Dow Theory HH-HL-LH-LL 2025
//--------------------------------------------
✅ Purpose
This indicator visualizes Dow Theory structure by identifying:
//--------------------------------------------
Higher Highs (HH)
Higher Lows (HL)
Lower Highs (LH)
Lower Lows (LL)
//--------------------------------------------
It helps traders clearly identify market trends, trend reversals, and structure shifts in real time —
crucial for both swing and intraday traders.
//--------------------------------------------
⚙️ Key Features & User Settings
//--------------------------------------------
🟩 1. New Day Highlight
Show_New_Day: Toggle ON/OFF background color for new trading days.
ND_Fill_Transp: Set transparency level of the day start background Color Box Line.
📏 2. Pivot Point Settings
Pivot_Period: Set the period used to detect pivot highs/lows Default is 5.
🎯 3. Line & Label Display
Show_Line: Show/hide support/resistance lines at HH, HL, LH, LL.
Show_Lbl: Show/hide text labels on chart.
Show_With_Price: Display price along with HH-HL-LH-LL labels.
🎨 4. Visual Themes
Select_Theme: Choose between 'Color' or 'Gray' for a colorful or minimal style.
✍️ 5. Support/Resistance Line Style
Line Width, Line Style: Customize thickness and style of lines.
Line Transparency: Set transparency of lines.
🏷️ 6. Label Text Styling
Lbl_Transp: Set background transparency for labels Default is 100 You can Change it any time to Show Label Background.
Txt_Transp: Set text transparency Default is 0 .
Txt_Size: Adjust label font size Default is 10.
🟡🟡🟡 And Best Thing of Indicator is you can Check Price any time Hovering on the Label - For Quick Referance 🟡🟡🟡
//--------------------------------------------
Trend Direction
//--------------------------------------------
🔹 Identify trend continuation or reversal zones.
🔹 Mark structure breakpoints to place stop losses.
🔹 Confirm signals from other indicators (RSI, EMA, VWAP, etc.).
🔹 Analyze price action with pure structure — no lagging indicators.
✅ Fix: Reset Label Repainting issue
보호된 스크립트입니다
이 스크립트는 비공개 소스로 게시됩니다. 하지만 이를 자유롭게 제한 없이 사용할 수 있습니다 – 자세한 내용은 여기에서 확인하세요.
면책사항
해당 정보와 게시물은 금융, 투자, 트레이딩 또는 기타 유형의 조언이나 권장 사항으로 간주되지 않으며, 트레이딩뷰에서 제공하거나 보증하는 것이 아닙니다. 자세한 내용은 이용 약관을 참조하세요.
보호된 스크립트입니다
이 스크립트는 비공개 소스로 게시됩니다. 하지만 이를 자유롭게 제한 없이 사용할 수 있습니다 – 자세한 내용은 여기에서 확인하세요.
면책사항
해당 정보와 게시물은 금융, 투자, 트레이딩 또는 기타 유형의 조언이나 권장 사항으로 간주되지 않으며, 트레이딩뷰에서 제공하거나 보증하는 것이 아닙니다. 자세한 내용은 이용 약관을 참조하세요.