OPEN-SOURCE SCRIPT
Candle Strategy
This strategy is based candle count number also strategy analysis -
Rules for buy-
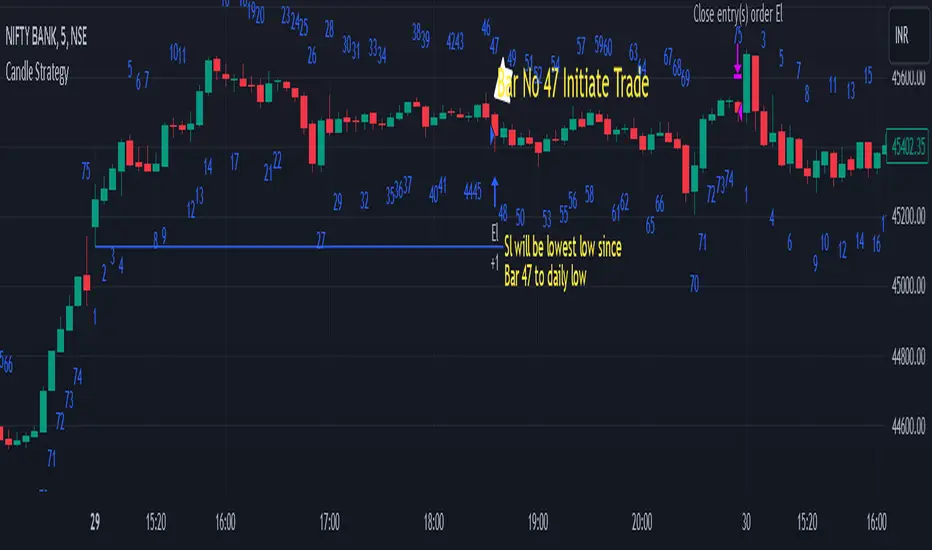
1) choose Candle Number(Ex.-47) For Trade
2) Trade Sell if price is above high of day 1st candle that mean direction is upside
3) We are taking stop loss on lowest low of candle since day first candle to trade no.
4) close Trade at last bar of the day
5) Trader Can Choose Trade Direction From input

Rules for Sell-
1) Choose Candle Number(Ex.-47) For Trade
2) Trade Sell if price is below low of day 1st candle that mean direction is downside
3) We are taking stop loss on highest of candle since day first candle to trade no.
4) close Trade at last bar of the day
5) Trader Can Choose Trade Direction From input
Note - this strategy can be also use for static to understand which candle will make low/high of the day high chance Example in bank nifty 5 minutes chart candle no 47 have highest trade
opportunity appear on long side ...this data is small based on 5000 previous bar ...
Disclaimer: market involves significant risks, including complete possible loss of funds. Consequently trading is not suitable for all investors and traders. By increasing leverage risk increases as well.With the demo account you can test any trading strategies you wish in a risk-free environment. Please bear in mind that the results of the transactions of the practice account are virtual, and do not reflect any real profit or loss or a real trading environment, whereas market conditions may affect both the quotation and execution
Rules for buy-
1) choose Candle Number(Ex.-47) For Trade
2) Trade Sell if price is above high of day 1st candle that mean direction is upside
3) We are taking stop loss on lowest low of candle since day first candle to trade no.
4) close Trade at last bar of the day
5) Trader Can Choose Trade Direction From input
Rules for Sell-
1) Choose Candle Number(Ex.-47) For Trade
2) Trade Sell if price is below low of day 1st candle that mean direction is downside
3) We are taking stop loss on highest of candle since day first candle to trade no.
4) close Trade at last bar of the day
5) Trader Can Choose Trade Direction From input
Note - this strategy can be also use for static to understand which candle will make low/high of the day high chance Example in bank nifty 5 minutes chart candle no 47 have highest trade
opportunity appear on long side ...this data is small based on 5000 previous bar ...
Disclaimer: market involves significant risks, including complete possible loss of funds. Consequently trading is not suitable for all investors and traders. By increasing leverage risk increases as well.With the demo account you can test any trading strategies you wish in a risk-free environment. Please bear in mind that the results of the transactions of the practice account are virtual, and do not reflect any real profit or loss or a real trading environment, whereas market conditions may affect both the quotation and execution
오픈 소스 스크립트
트레이딩뷰의 진정한 정신에 따라, 이 스크립트의 작성자는 이를 오픈소스로 공개하여 트레이더들이 기능을 검토하고 검증할 수 있도록 했습니다. 작성자에게 찬사를 보냅니다! 이 코드는 무료로 사용할 수 있지만, 코드를 재게시하는 경우 하우스 룰이 적용된다는 점을 기억하세요.
면책사항
해당 정보와 게시물은 금융, 투자, 트레이딩 또는 기타 유형의 조언이나 권장 사항으로 간주되지 않으며, 트레이딩뷰에서 제공하거나 보증하는 것이 아닙니다. 자세한 내용은 이용 약관을 참조하세요.
오픈 소스 스크립트
트레이딩뷰의 진정한 정신에 따라, 이 스크립트의 작성자는 이를 오픈소스로 공개하여 트레이더들이 기능을 검토하고 검증할 수 있도록 했습니다. 작성자에게 찬사를 보냅니다! 이 코드는 무료로 사용할 수 있지만, 코드를 재게시하는 경우 하우스 룰이 적용된다는 점을 기억하세요.
면책사항
해당 정보와 게시물은 금융, 투자, 트레이딩 또는 기타 유형의 조언이나 권장 사항으로 간주되지 않으며, 트레이딩뷰에서 제공하거나 보증하는 것이 아닙니다. 자세한 내용은 이용 약관을 참조하세요.