INVITE-ONLY SCRIPT
업데이트됨 Price Barrier I1-PB
Idea:
This script combines: Parabolic SAR, Stochastic RSI and MA
SAR is used to determine the price direction of an asset, as well as draw attention to when the price direction is changing.
Combine Stochastic RSI to point out the strength of the SAR signals.(Of course the setting for Stochastic RSI in this script is customized).
Then using MA to calculate and plot.
The plot line of this script at the center line and draw 2 line with offset to the center line.
Concept:
(Note that we take the close to get the closing price)
-SAR provides series of dots placed either above or below the price bars. A dot below the price is deemed to be a bullish signal.
-Stochastic RSI with its crossing of K and D line, last crossing of K and D will be recognized as crossing point. The direction of latest points will be current trend also in some case value above 80 is Over Buy and below 20 is Over Sell.
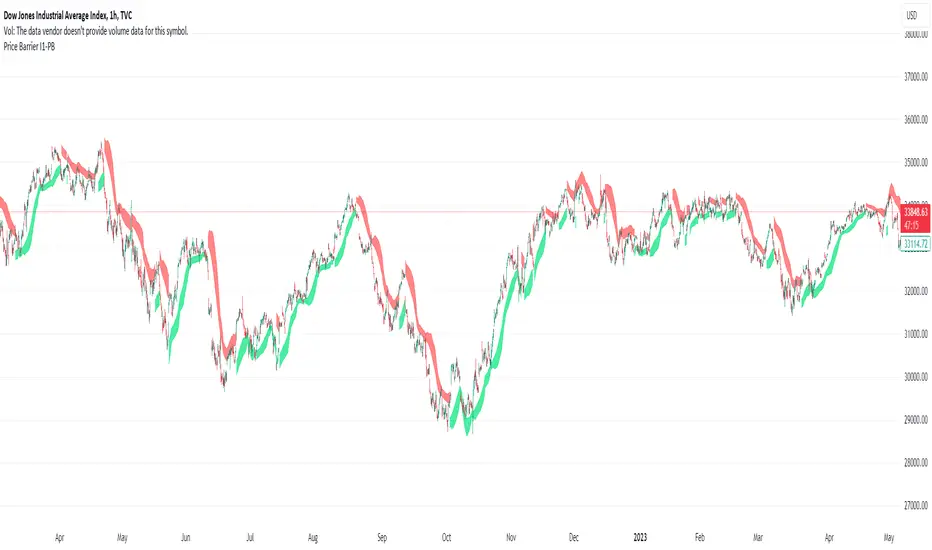
-So how could we present the domain line? (The domain line are two line with background color filled) Using the deviation from the MA as the baseline, we will draw two lines with 2 distinct points, then color them. We will call them price barrier. There are 4 plot MA, 2 for above and 2 for below.
-Strength of barrier calculation based on SAR and RSI mentioned above.
How it works:
1. The price barrier (domain line) displays above and below bar which could be resistance or support for current bar.
- Yellow means the soon/week signal.
- Green below bar means the support barrier.
- Red above bar mean the resistance barrier.
2. This indicator provides a warning signal when the color of the price barrier changes.
- Above barrier's color:
+Turn red: "Down Red"
+Turn yellow: "Down Yellow"
- Below barrier's color:
+Turn green: "Up Green"
+Turn yellow: "Up Yellow"
Suitable time frames:
4h, 1D, 1W
* Please note that this logic does not attempt to predict future prices or 100% accurate signal.
(INVITE ONLY indicator. Please direct message or visit website if you want to try it out)
Hope you guys enjoy!
Examples:
BTCUSD 4H

XAUUSD 1D

EURUSD 1D

AAPL 1D

This script combines: Parabolic SAR, Stochastic RSI and MA
SAR is used to determine the price direction of an asset, as well as draw attention to when the price direction is changing.
Combine Stochastic RSI to point out the strength of the SAR signals.(Of course the setting for Stochastic RSI in this script is customized).
Then using MA to calculate and plot.
The plot line of this script at the center line and draw 2 line with offset to the center line.
Concept:
(Note that we take the close to get the closing price)
-SAR provides series of dots placed either above or below the price bars. A dot below the price is deemed to be a bullish signal.
-Stochastic RSI with its crossing of K and D line, last crossing of K and D will be recognized as crossing point. The direction of latest points will be current trend also in some case value above 80 is Over Buy and below 20 is Over Sell.
-So how could we present the domain line? (The domain line are two line with background color filled) Using the deviation from the MA as the baseline, we will draw two lines with 2 distinct points, then color them. We will call them price barrier. There are 4 plot MA, 2 for above and 2 for below.
-Strength of barrier calculation based on SAR and RSI mentioned above.
How it works:
1. The price barrier (domain line) displays above and below bar which could be resistance or support for current bar.
- Yellow means the soon/week signal.
- Green below bar means the support barrier.
- Red above bar mean the resistance barrier.
2. This indicator provides a warning signal when the color of the price barrier changes.
- Above barrier's color:
+Turn red: "Down Red"
+Turn yellow: "Down Yellow"
- Below barrier's color:
+Turn green: "Up Green"
+Turn yellow: "Up Yellow"
Suitable time frames:
4h, 1D, 1W
* Please note that this logic does not attempt to predict future prices or 100% accurate signal.
(INVITE ONLY indicator. Please direct message or visit website if you want to try it out)
Hope you guys enjoy!
Examples:
BTCUSD 4H
XAUUSD 1D
EURUSD 1D
AAPL 1D
릴리즈 노트
Update barrier resolution.릴리즈 노트
Update barrier resolution릴리즈 노트
- Change barriers resolution.
- Remove yellow color and refactor code to add in BBoard.
- Change alert message with "Support" and "Resistance" .
릴리즈 노트
Line smoothing릴리즈 노트
Update color for darkmode초대 전용 스크립트
이 스크립트는 작성자가 승인한 사용자만 접근할 수 있습니다. 사용하려면 요청 후 승인을 받아야 하며, 일반적으로 결제 후에 허가가 부여됩니다. 자세한 내용은 아래 작성자의 안내를 따르거나 albedor에게 직접 문의하세요.
트레이딩뷰는 스크립트의 작동 방식을 충분히 이해하고 작성자를 완전히 신뢰하지 않는 이상, 해당 스크립트에 비용을 지불하거나 사용하는 것을 권장하지 않습니다. 커뮤니티 스크립트에서 무료 오픈소스 대안을 찾아보실 수도 있습니다.
작성자 지시 사항
Please direct message or visit website to try it out.
면책사항
해당 정보와 게시물은 금융, 투자, 트레이딩 또는 기타 유형의 조언이나 권장 사항으로 간주되지 않으며, 트레이딩뷰에서 제공하거나 보증하는 것이 아닙니다. 자세한 내용은 이용 약관을 참조하세요.
초대 전용 스크립트
이 스크립트는 작성자가 승인한 사용자만 접근할 수 있습니다. 사용하려면 요청 후 승인을 받아야 하며, 일반적으로 결제 후에 허가가 부여됩니다. 자세한 내용은 아래 작성자의 안내를 따르거나 albedor에게 직접 문의하세요.
트레이딩뷰는 스크립트의 작동 방식을 충분히 이해하고 작성자를 완전히 신뢰하지 않는 이상, 해당 스크립트에 비용을 지불하거나 사용하는 것을 권장하지 않습니다. 커뮤니티 스크립트에서 무료 오픈소스 대안을 찾아보실 수도 있습니다.
작성자 지시 사항
Please direct message or visit website to try it out.
면책사항
해당 정보와 게시물은 금융, 투자, 트레이딩 또는 기타 유형의 조언이나 권장 사항으로 간주되지 않으며, 트레이딩뷰에서 제공하거나 보증하는 것이 아닙니다. 자세한 내용은 이용 약관을 참조하세요.