OPEN-SOURCE SCRIPT
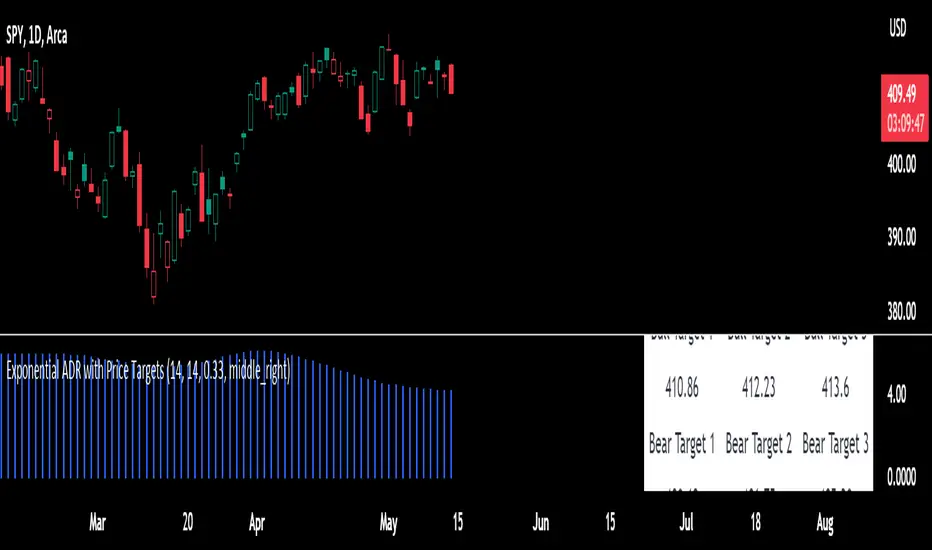
Exponential ADR with Price Targets
This script is designed to help you analyze price movements in the financial markets by calculating the Average Daily Range (ADR), adjusting it based on exponentiality and generating price targets based on that range.
The ADR represents the average range between the highest and lowest prices of a trading instrument during a specific period. It gives you an idea of how much the price typically moves in a day. In this script, we calculate the ADR using Simple Moving Averages (SMA) of the high and low prices over a certain length of time. You can customize this length according to your preference.
To make the ADR smoother and more responsive to recent price changes, we apply an Exponential Moving Average (EMA) to the ADR values. The EMA places more weight on recent data, giving you a more up-to-date measure of the ADR. The length of the EMA is also adjustable.
Once we have the Exponential ADR, we can generate price targets based on it. Price targets are potential levels where the price may reach in the future. We calculate these targets by adding or subtracting a certain multiple of the Exponential ADR from the current closing price. The multiple is determined by a parameter called the "Target Multiplier." You can adjust this value to control the distance of the price targets from the closing price.
In addition to plotting the Exponential ADR as a histogram on the chart, we create a table that displays the price targets. The table shows three bullish (positive) targets and three bearish (negative) targets. The targets are labeled as "Bull Target" or "Bear Target" followed by a number indicating the target's order. For each target, we display the corresponding price level.
To estimate the potential price levels, we used a formula that takes into account the current closing price and a value called the Exponential Average Daily Range (Exponential ADR). The Exponential ADR represents the average range of price movement over a specific period.
To calculate the price targets, we multiplied the Exponential ADR by a user-defined value called the target multiplier. This target multiplier allows traders to control the distance of the price targets from the current price. The resulting value indicates the desired distance from the current price for each target level.
For bullish targets, we added the calculated value to the current closing price. This suggests potential upward movement in the price. On the other hand, for bearish targets, we subtracted the calculated value from the current closing price. This indicates potential downward movement in the price.
By providing multiple target levels, such as level 1, level 2, and level 3, traders can assess different scenarios and potential price outcomes. These target levels help traders identify possible price levels where they might consider taking profit or adjusting their trading positions.
It's important to note that these price targets are not guaranteed to be reached, but they serve as reference points based on historical price behavior and the Exponential ADR. Traders can use them as part of their overall trading strategy and decision-making process.
Adjust the input parameters according to your desired settings, such as the ADR length, EMA length, target multiplier, table position, and table style. The indicator will then calculate and display the Exponential ADR and price targets on the chart, helping you identify potential levels of support and resistance for your trading decisions.
오픈 소스 스크립트
트레이딩뷰의 진정한 정신에 따라, 이 스크립트의 작성자는 이를 오픈소스로 공개하여 트레이더들이 기능을 검토하고 검증할 수 있도록 했습니다. 작성자에게 찬사를 보냅니다! 이 코드는 무료로 사용할 수 있지만, 코드를 재게시하는 경우 하우스 룰이 적용된다는 점을 기억하세요.
면책사항
해당 정보와 게시물은 금융, 투자, 트레이딩 또는 기타 유형의 조언이나 권장 사항으로 간주되지 않으며, 트레이딩뷰에서 제공하거나 보증하는 것이 아닙니다. 자세한 내용은 이용 약관을 참조하세요.
오픈 소스 스크립트
트레이딩뷰의 진정한 정신에 따라, 이 스크립트의 작성자는 이를 오픈소스로 공개하여 트레이더들이 기능을 검토하고 검증할 수 있도록 했습니다. 작성자에게 찬사를 보냅니다! 이 코드는 무료로 사용할 수 있지만, 코드를 재게시하는 경우 하우스 룰이 적용된다는 점을 기억하세요.
면책사항
해당 정보와 게시물은 금융, 투자, 트레이딩 또는 기타 유형의 조언이나 권장 사항으로 간주되지 않으며, 트레이딩뷰에서 제공하거나 보증하는 것이 아닙니다. 자세한 내용은 이용 약관을 참조하세요.