OPEN-SOURCE SCRIPT
TradingCharts SCTR [Bginvestor]
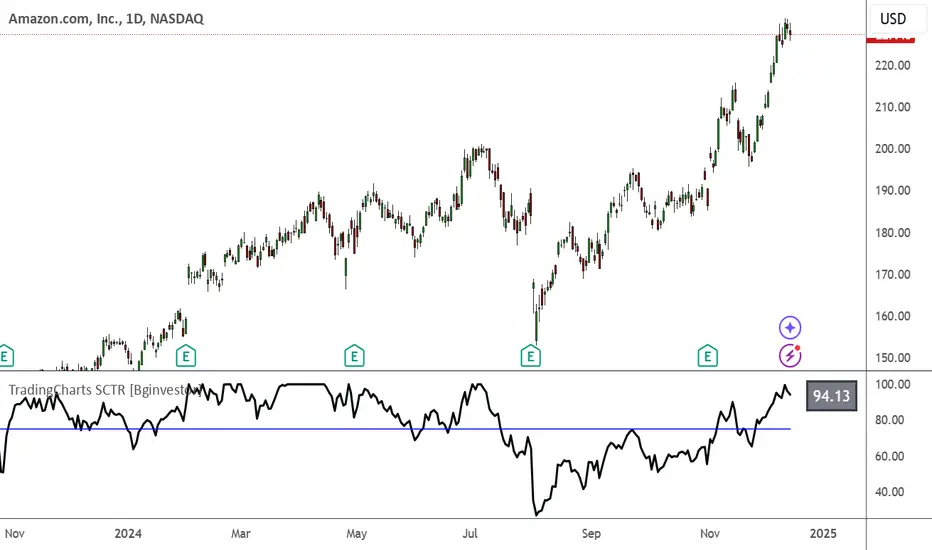
This indicator is replicating Tradingcharts, SCTR plot. If you know, you know.
Brief description: The StockCharts Technical Rank (SCTR), conceived by technical analyst John Murphy, emerges as a pivotal tool in evaluating a stock’s technical prowess. This numerical system, colloquially known as “scooter,” gauges a stock’s strength within various groups, employing six key technical indicators across different time frames.
How to use it:
Long-term indicators (30% weight each)
-Percent above/below the 200-day exponential moving average (EMA)
-125-day rate-of-change (ROC)
Medium-term indicators (15% weight each)
-percent above/below 50-day EMA
-20-day rate-of-change
Short-term indicators (5% weight each)
-Three-day slope of percentage price oscillator histogram divided by three
-Relative strength index
How to use SCTR:
Investors select a specific group for analysis, and the SCTR assigns rankings within that group. A score of 99.99 denotes robust technical performance, while zero signals pronounced underperformance. Traders leverage this data for strategic decision-making, identifying stocks with increasing SCTR for potential buying or spotting weak stocks for potential shorting.
Credit: I've made some modifications, but credit goes to GodziBear for back engineering the averaging / scaling of the equations.
Note: Not a perfect match to TradingCharts, but very, very close.
오픈 소스 스크립트
트레이딩뷰의 진정한 정신에 따라, 이 스크립트의 작성자는 이를 오픈소스로 공개하여 트레이더들이 기능을 검토하고 검증할 수 있도록 했습니다. 작성자에게 찬사를 보냅니다! 이 코드는 무료로 사용할 수 있지만, 코드를 재게시하는 경우 하우스 룰이 적용된다는 점을 기억하세요.
면책사항
해당 정보와 게시물은 금융, 투자, 트레이딩 또는 기타 유형의 조언이나 권장 사항으로 간주되지 않으며, 트레이딩뷰에서 제공하거나 보증하는 것이 아닙니다. 자세한 내용은 이용 약관을 참조하세요.
오픈 소스 스크립트
트레이딩뷰의 진정한 정신에 따라, 이 스크립트의 작성자는 이를 오픈소스로 공개하여 트레이더들이 기능을 검토하고 검증할 수 있도록 했습니다. 작성자에게 찬사를 보냅니다! 이 코드는 무료로 사용할 수 있지만, 코드를 재게시하는 경우 하우스 룰이 적용된다는 점을 기억하세요.
면책사항
해당 정보와 게시물은 금융, 투자, 트레이딩 또는 기타 유형의 조언이나 권장 사항으로 간주되지 않으며, 트레이딩뷰에서 제공하거나 보증하는 것이 아닙니다. 자세한 내용은 이용 약관을 참조하세요.