OPEN-SOURCE SCRIPT
Early MACD Reversal Indicator
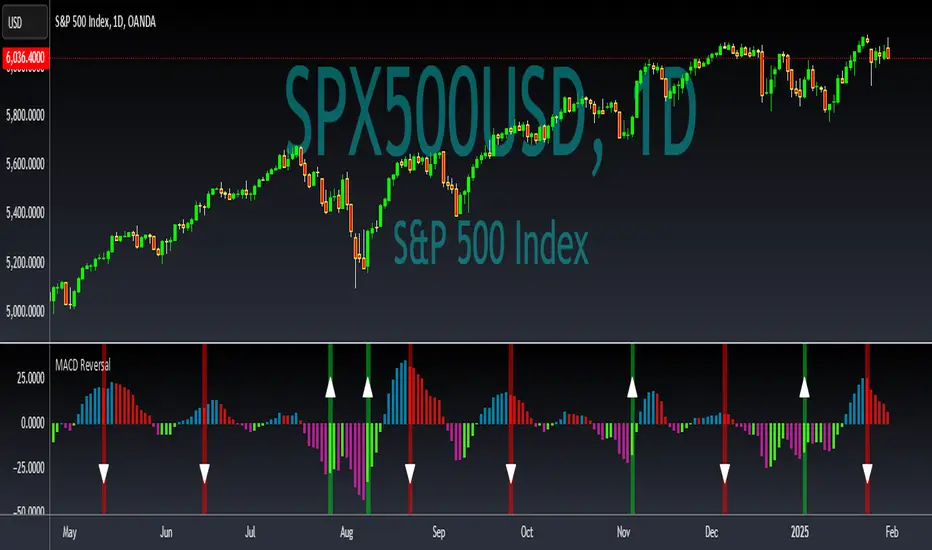
This indicator should provide early warnings of potential price reversal based on the difference between the MACD and its signal line. The keys of the reversal come from creating a histogram of the difference between the two lines and further monitoring the first indications of breadth decrease. The first change when trending up will paint a red vertical line and downward triangle to indicate potential trend reversal to the low side. The opposite with a green vertical line and upward triangle signals potential upside movement soon.
Enjoy!
Enjoy!
오픈 소스 스크립트
트레이딩뷰의 진정한 정신에 따라, 이 스크립트의 작성자는 이를 오픈소스로 공개하여 트레이더들이 기능을 검토하고 검증할 수 있도록 했습니다. 작성자에게 찬사를 보냅니다! 이 코드는 무료로 사용할 수 있지만, 코드를 재게시하는 경우 하우스 룰이 적용된다는 점을 기억하세요.
All forecasts are based on analysis of past behavior. Prior movements are not always indicative of future movement. Develop the theory, test the theory. Do your own research. Nothing in this analysis constitutes advice. YouTube For More. Good luck!!
면책사항
해당 정보와 게시물은 금융, 투자, 트레이딩 또는 기타 유형의 조언이나 권장 사항으로 간주되지 않으며, 트레이딩뷰에서 제공하거나 보증하는 것이 아닙니다. 자세한 내용은 이용 약관을 참조하세요.