OPEN-SOURCE SCRIPT
Compression support&resistance [LM]
Hello traders,
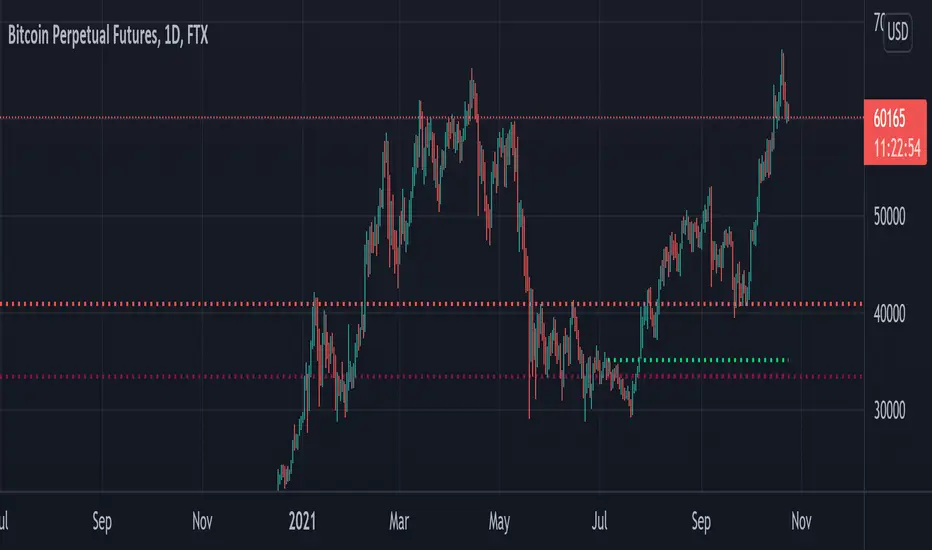
I would like to present you Compression support&resistance script. The idea behind is to look for areas of price compression(inside bar candles). Basically the S/R lines are created after three candles that are formed in certain pattern and volume conditions. First candle of pattern is usually the most volatile and fist inside bar after volatile candle high and low creates S/R lines in order to look for breakouts or for future bounces of the S/R line. Also by default volume has to be decreasing from candle to candle, although this condition can be controlled by setting.

It has various settings as my other S/R scripts for multi timeframe analysis. The current timeframe uses line API but for multi timeframe I use plot lines. There are two filters. Volume filter for declining volume of the pattern candles and volatility filter which renders line only in case that pattern occurs after some % change has happened within some lookback period.
Credit also for this indicator goes to @berkek as he took time to explain it to me.
Hope you will enjoy it,
Lukas
I would like to present you Compression support&resistance script. The idea behind is to look for areas of price compression(inside bar candles). Basically the S/R lines are created after three candles that are formed in certain pattern and volume conditions. First candle of pattern is usually the most volatile and fist inside bar after volatile candle high and low creates S/R lines in order to look for breakouts or for future bounces of the S/R line. Also by default volume has to be decreasing from candle to candle, although this condition can be controlled by setting.
It has various settings as my other S/R scripts for multi timeframe analysis. The current timeframe uses line API but for multi timeframe I use plot lines. There are two filters. Volume filter for declining volume of the pattern candles and volatility filter which renders line only in case that pattern occurs after some % change has happened within some lookback period.
Credit also for this indicator goes to @berkek as he took time to explain it to me.
Hope you will enjoy it,
Lukas
오픈 소스 스크립트
트레이딩뷰의 진정한 정신에 따라, 이 스크립트의 작성자는 이를 오픈소스로 공개하여 트레이더들이 기능을 검토하고 검증할 수 있도록 했습니다. 작성자에게 찬사를 보냅니다! 이 코드는 무료로 사용할 수 있지만, 코드를 재게시하는 경우 하우스 룰이 적용된다는 점을 기억하세요.
면책사항
해당 정보와 게시물은 금융, 투자, 트레이딩 또는 기타 유형의 조언이나 권장 사항으로 간주되지 않으며, 트레이딩뷰에서 제공하거나 보증하는 것이 아닙니다. 자세한 내용은 이용 약관을 참조하세요.
오픈 소스 스크립트
트레이딩뷰의 진정한 정신에 따라, 이 스크립트의 작성자는 이를 오픈소스로 공개하여 트레이더들이 기능을 검토하고 검증할 수 있도록 했습니다. 작성자에게 찬사를 보냅니다! 이 코드는 무료로 사용할 수 있지만, 코드를 재게시하는 경우 하우스 룰이 적용된다는 점을 기억하세요.
면책사항
해당 정보와 게시물은 금융, 투자, 트레이딩 또는 기타 유형의 조언이나 권장 사항으로 간주되지 않으며, 트레이딩뷰에서 제공하거나 보증하는 것이 아닙니다. 자세한 내용은 이용 약관을 참조하세요.