OPEN-SOURCE SCRIPT
Custom Hourly Highlight Periods
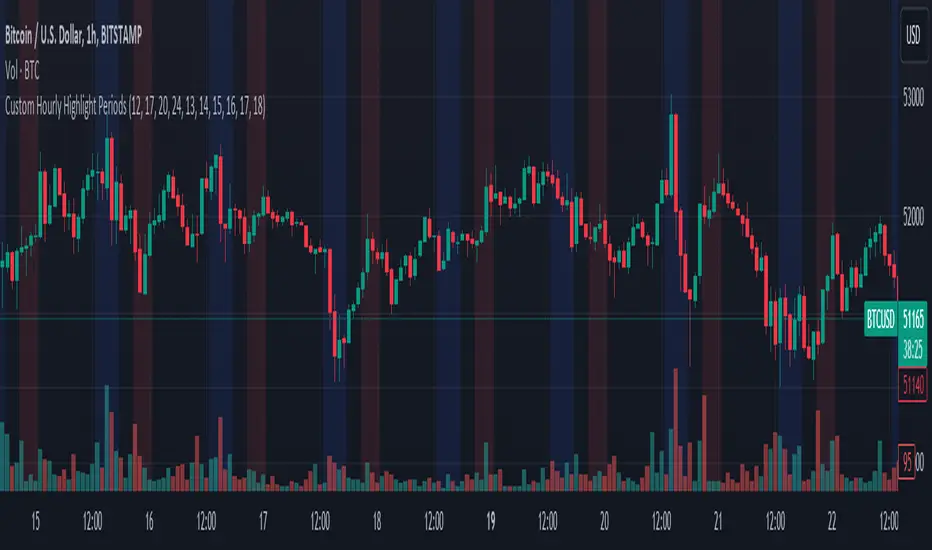
This Pine Script indicator for TradingView allows users to visually highlight up to five distinct periods within a trading day directly on their chart. It's designed to enhance chart analysis by emphasizing specific time frames that may coincide with increased market activity, trading sessions, or personal trading strategies.
Features:
Use Cases:
Features:
- Customizable Highlight Periods: Users can define up to five separate highlight periods, specifying both start and end hours for each. This flexibility supports a wide range of trading strategies and time zones.
- Individual Period Activation: Each highlight period can be individually enabled or disabled, allowing users to focus on specific times of interest without cluttering the chart.
- Color-Coded Visualization: Each period is highlighted with a different transparent color (blue, red, green, purple, and orange) for clear distinction between different segments of the trading day. Colors are customizable to fit personal preferences or chart themes.
- User-Friendly Inputs: Simple input fields make it easy to adjust start/end times and toggle the visibility of each period, requiring no coding experience to customize.
Use Cases:
- Identifying Repeating Patterns: Certain regional markets exhibit unique behaviors, with some creating sell pressure in the morning, while others generate buy pressure. This indicator allows for clear visualization of these patterns.
- Market Session Highlights: Emphasize the opening and closing hours of major markets (e.g., NYSE, NASDAQ, Forex markets) to identify potential volatility or trading opportunities.
- Personal Trading Hours: Mark the time frames when you typically trade or when your trading strategy performs best.
- Economic Release Times: Highlight periods when important economic reports are released, which can significantly impact market movement.
오픈 소스 스크립트
트레이딩뷰의 진정한 정신에 따라, 이 스크립트의 작성자는 이를 오픈소스로 공개하여 트레이더들이 기능을 검토하고 검증할 수 있도록 했습니다. 작성자에게 찬사를 보냅니다! 이 코드는 무료로 사용할 수 있지만, 코드를 재게시하는 경우 하우스 룰이 적용된다는 점을 기억하세요.
면책사항
해당 정보와 게시물은 금융, 투자, 트레이딩 또는 기타 유형의 조언이나 권장 사항으로 간주되지 않으며, 트레이딩뷰에서 제공하거나 보증하는 것이 아닙니다. 자세한 내용은 이용 약관을 참조하세요.
오픈 소스 스크립트
트레이딩뷰의 진정한 정신에 따라, 이 스크립트의 작성자는 이를 오픈소스로 공개하여 트레이더들이 기능을 검토하고 검증할 수 있도록 했습니다. 작성자에게 찬사를 보냅니다! 이 코드는 무료로 사용할 수 있지만, 코드를 재게시하는 경우 하우스 룰이 적용된다는 점을 기억하세요.
면책사항
해당 정보와 게시물은 금융, 투자, 트레이딩 또는 기타 유형의 조언이나 권장 사항으로 간주되지 않으며, 트레이딩뷰에서 제공하거나 보증하는 것이 아닙니다. 자세한 내용은 이용 약관을 참조하세요.