OPEN-SOURCE SCRIPT
업데이트됨 ATR Trend Reversal Zone indicator
This indicator helps avoid taking reversal trades too close to the 21 EMA, which may fail since the market often continues its trend after retracing from the 21 EMA level. It does not generate a direct signal for reversal trades but rather indicates points where you can consider potential reversal trades based on your trading methodology
This script defines an indicator that calculates the 21 Exponential Moving Average (EMA) and the Average True Range (ATR) for a given period. It then computes the distance between the most recent closing price and the 21 EMA in terms of ATR units. If this distance is equal to or greater than 3 ATRs, a small green circle is plotted below the corresponding bar on the chart, indicating a potential reversal condition.
This script defines an indicator that calculates the 21 Exponential Moving Average (EMA) and the Average True Range (ATR) for a given period. It then computes the distance between the most recent closing price and the 21 EMA in terms of ATR units. If this distance is equal to or greater than 3 ATRs, a small green circle is plotted below the corresponding bar on the chart, indicating a potential reversal condition.
릴리즈 노트
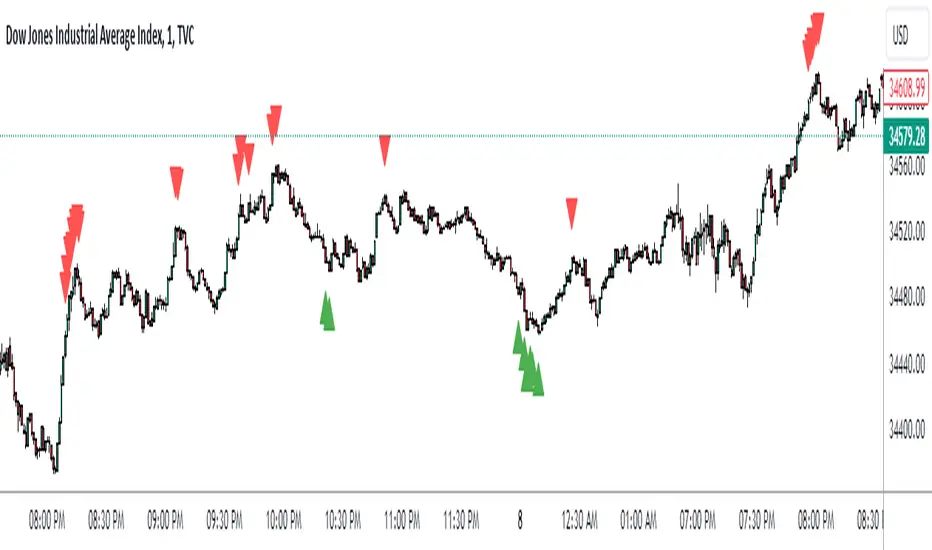
Update:This script will plot a red circle above the candle when the distance is greater than or equal to 3 and the close is above the 21 EMA. It will also plot a green circle below the candle when the distance is less than or equal to 3 and the close is below the 21 EMA.
It is strongly recommended to adjust the ATR values and thoroughly back test this indicator for the specific instrument and time frame you intend to trade.
릴리즈 노트
Update:Will update the script with ATR bands to increase performance.
릴리즈 노트
-오픈 소스 스크립트
트레이딩뷰의 진정한 정신에 따라, 이 스크립트의 작성자는 이를 오픈소스로 공개하여 트레이더들이 기능을 검토하고 검증할 수 있도록 했습니다. 작성자에게 찬사를 보냅니다! 이 코드는 무료로 사용할 수 있지만, 코드를 재게시하는 경우 하우스 룰이 적용된다는 점을 기억하세요.
면책사항
해당 정보와 게시물은 금융, 투자, 트레이딩 또는 기타 유형의 조언이나 권장 사항으로 간주되지 않으며, 트레이딩뷰에서 제공하거나 보증하는 것이 아닙니다. 자세한 내용은 이용 약관을 참조하세요.
오픈 소스 스크립트
트레이딩뷰의 진정한 정신에 따라, 이 스크립트의 작성자는 이를 오픈소스로 공개하여 트레이더들이 기능을 검토하고 검증할 수 있도록 했습니다. 작성자에게 찬사를 보냅니다! 이 코드는 무료로 사용할 수 있지만, 코드를 재게시하는 경우 하우스 룰이 적용된다는 점을 기억하세요.
면책사항
해당 정보와 게시물은 금융, 투자, 트레이딩 또는 기타 유형의 조언이나 권장 사항으로 간주되지 않으며, 트레이딩뷰에서 제공하거나 보증하는 것이 아닙니다. 자세한 내용은 이용 약관을 참조하세요.