OPEN-SOURCE SCRIPT
업데이트됨 Key Distances (Weekly, Daily Open, & EMA)
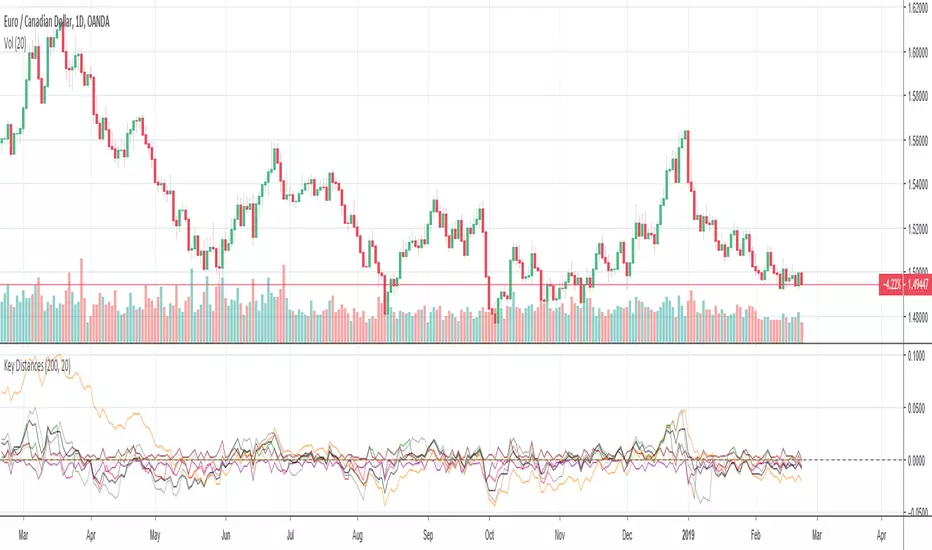
This indicator provides the pip value from various key levels I've found important in my trading system.
The results are graphed. I suggest that you choose the 2 most important ones you want to graph otherwise the indicator gets difficult to read.
The important data is the actual numbers but I've found it helpful to understand how a ticker moves in regards to weekly open and distance from 200EMA to be most helpful.
Here is the order of the data listed:
Future Possible Updates:
- customized EMA
- Distance from weekly low/high
The results are graphed. I suggest that you choose the 2 most important ones you want to graph otherwise the indicator gets difficult to read.
The important data is the actual numbers but I've found it helpful to understand how a ticker moves in regards to weekly open and distance from 200EMA to be most helpful.
Here is the order of the data listed:
- Distance from weekly open (green if above open, red if below open, also paints color on line)
- Distance from last week opening price
- Distance from daily open
- Distance to 200EMA
Future Possible Updates:
- customized EMA
- Distance from weekly low/high
릴리즈 노트
Wanted to add some customization and zero line. Here's details to this update:- Zero Line added. Now you can turn on and plot the zero line.
- Added slow EMA input that can be changed (default is 200)
- Added fast EMA input that can be changed (default is 20)
The numbers are what I feel are most important but graphing 1-3 of these numbers can help in possibly getting a good feel of how a ticker moves from these distances or in creating alerts.
릴리즈 노트
Added Daily high, low and close.You can turn off or customize all plots. This indicator is primarily used to visually backtest other indicators to look for patterns in price action. So usually just turn on a few plots or use the information panel to get the raw numbers.
오픈 소스 스크립트
트레이딩뷰의 진정한 정신에 따라, 이 스크립트의 작성자는 이를 오픈소스로 공개하여 트레이더들이 기능을 검토하고 검증할 수 있도록 했습니다. 작성자에게 찬사를 보냅니다! 이 코드는 무료로 사용할 수 있지만, 코드를 재게시하는 경우 하우스 룰이 적용된다는 점을 기억하세요.
면책사항
해당 정보와 게시물은 금융, 투자, 트레이딩 또는 기타 유형의 조언이나 권장 사항으로 간주되지 않으며, 트레이딩뷰에서 제공하거나 보증하는 것이 아닙니다. 자세한 내용은 이용 약관을 참조하세요.
오픈 소스 스크립트
트레이딩뷰의 진정한 정신에 따라, 이 스크립트의 작성자는 이를 오픈소스로 공개하여 트레이더들이 기능을 검토하고 검증할 수 있도록 했습니다. 작성자에게 찬사를 보냅니다! 이 코드는 무료로 사용할 수 있지만, 코드를 재게시하는 경우 하우스 룰이 적용된다는 점을 기억하세요.
면책사항
해당 정보와 게시물은 금융, 투자, 트레이딩 또는 기타 유형의 조언이나 권장 사항으로 간주되지 않으며, 트레이딩뷰에서 제공하거나 보증하는 것이 아닙니다. 자세한 내용은 이용 약관을 참조하세요.