OPEN-SOURCE SCRIPT
업데이트됨 Moving Average Percentage Difference
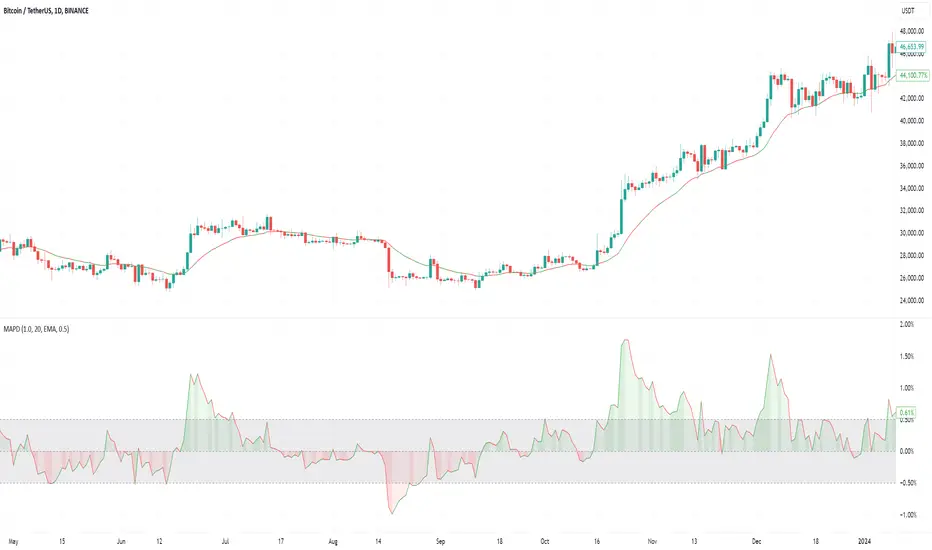
Moving average is a great tool to identify the asset direction. However, it's hard to see whether the moving average speeds up or slows down from just looking at it. Ideally we want it to go faster as it will show a strong trend. And if it slows down - then the trend becomes weaker. This indicator helps to identify it. Theoretically, it could be shown with an angle of the moving average, but I don't like this idea as the angle depends on the scale: you zoom in and it looks very steep, you zoom out - and it's all flat. But the percentage change is always the percentage, no matter what zoom you use.
It also allows you to set a twilight zone to filter periods when MA does nothing.
Think about this indicator from this perspective: if a normal moving average shows the speed of a trend, then this indicator shows the change of the speed or in other words - acceleration.
It also allows you to set a twilight zone to filter periods when MA does nothing.
Think about this indicator from this perspective: if a normal moving average shows the speed of a trend, then this indicator shows the change of the speed or in other words - acceleration.
릴리즈 노트
V1.1:- Updated PineScript to V6
- Updated the description (see below)
What does this indicator do (for regular users)?
It calculates the percentage change of a moving average compared to its value one candle ago. You can choose from seven types of moving averages.
What does this indicator do (for technical users)?
It computes the rate of change (ROC) with a period of 2 for SMA, EMA, VWMA, RMA, WMA, HMA, or SWMA.
Why is this important?
Traders often use the point when a moving average changes direction as a signal for entry or exit. This indicator helps anticipate such changes. Before a moving average changes direction, it must first slow down. The indicator reveals whether the moving average is slowing down or speeding up.
Think of it like this: before a car moves backward, it must slow down, stop, and then reverse. Moving averages behave similarly. Instead of guessing whether your moving average is slowing down or speeding up just by observing it, you can use this indicator to get a precise numeric value.
Additional feature:
You can define a "twilight zone" to highlight areas where the moving average experiences whipsawing. This is useful for trend followers to avoid flat periods or for mean-reversion strategies to identify favorable conditions.
오픈 소스 스크립트
트레이딩뷰의 진정한 정신에 따라, 이 스크립트의 작성자는 이를 오픈소스로 공개하여 트레이더들이 기능을 검토하고 검증할 수 있도록 했습니다. 작성자에게 찬사를 보냅니다! 이 코드는 무료로 사용할 수 있지만, 코드를 재게시하는 경우 하우스 룰이 적용된다는 점을 기억하세요.
면책사항
해당 정보와 게시물은 금융, 투자, 트레이딩 또는 기타 유형의 조언이나 권장 사항으로 간주되지 않으며, 트레이딩뷰에서 제공하거나 보증하는 것이 아닙니다. 자세한 내용은 이용 약관을 참조하세요.
오픈 소스 스크립트
트레이딩뷰의 진정한 정신에 따라, 이 스크립트의 작성자는 이를 오픈소스로 공개하여 트레이더들이 기능을 검토하고 검증할 수 있도록 했습니다. 작성자에게 찬사를 보냅니다! 이 코드는 무료로 사용할 수 있지만, 코드를 재게시하는 경우 하우스 룰이 적용된다는 점을 기억하세요.
면책사항
해당 정보와 게시물은 금융, 투자, 트레이딩 또는 기타 유형의 조언이나 권장 사항으로 간주되지 않으며, 트레이딩뷰에서 제공하거나 보증하는 것이 아닙니다. 자세한 내용은 이용 약관을 참조하세요.