OPEN-SOURCE SCRIPT
TICK Price Label Colors[Salty]

The ticker symbol for the NYSE CUMULATIVE Tick Index is TICK. The Tick Index is a short-term indicator that shows the number of stocks trading up minus the number of stocks trading down. Traders can use this ratio to make quick trading decisions based on market movement. For example, a positive tick index can indicate market optimism, while readings of +1,000 and -1,000 can indicate overbought or oversold conditions.
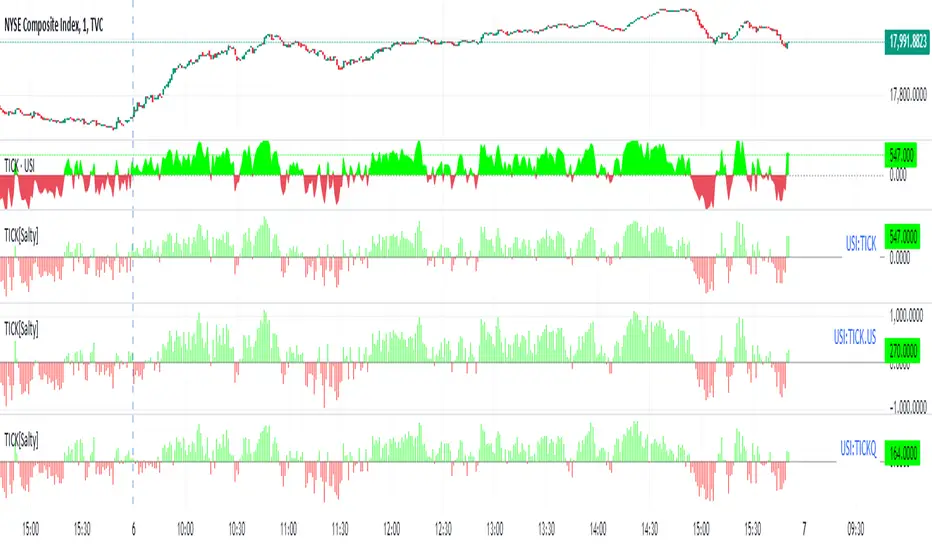
This script is used to color code the price label of the Symbol values zero or above in Green(default), and values below zero in red(default). For a dynamic symbol like the TICK this tells me the market is bullish when Green or Bearish when Red. I was previously using the baseline style with a Base level of 50 to accomplish this view of the symbol, but it was always difficult to maintain the zero level at the zero TICK value. This indicator is always able to color code the price label properly. Also, it has the benefit of setting the timeframe to 1 second(default) that is maintained even when the chart timeframe is changed.
Update: Added the ability to show the TICK Symbol to support viewing multiple TICK tickers at once as shown.
오픈 소스 스크립트
트레이딩뷰의 진정한 정신에 따라, 이 스크립트의 작성자는 이를 오픈소스로 공개하여 트레이더들이 기능을 검토하고 검증할 수 있도록 했습니다. 작성자에게 찬사를 보냅니다! 이 코드는 무료로 사용할 수 있지만, 코드를 재게시하는 경우 하우스 룰이 적용된다는 점을 기억하세요.
면책사항
해당 정보와 게시물은 금융, 투자, 트레이딩 또는 기타 유형의 조언이나 권장 사항으로 간주되지 않으며, 트레이딩뷰에서 제공하거나 보증하는 것이 아닙니다. 자세한 내용은 이용 약관을 참조하세요.
오픈 소스 스크립트
트레이딩뷰의 진정한 정신에 따라, 이 스크립트의 작성자는 이를 오픈소스로 공개하여 트레이더들이 기능을 검토하고 검증할 수 있도록 했습니다. 작성자에게 찬사를 보냅니다! 이 코드는 무료로 사용할 수 있지만, 코드를 재게시하는 경우 하우스 룰이 적용된다는 점을 기억하세요.
면책사항
해당 정보와 게시물은 금융, 투자, 트레이딩 또는 기타 유형의 조언이나 권장 사항으로 간주되지 않으며, 트레이딩뷰에서 제공하거나 보증하는 것이 아닙니다. 자세한 내용은 이용 약관을 참조하세요.