PROTECTED SOURCE SCRIPT
Tweak Strat FTFC
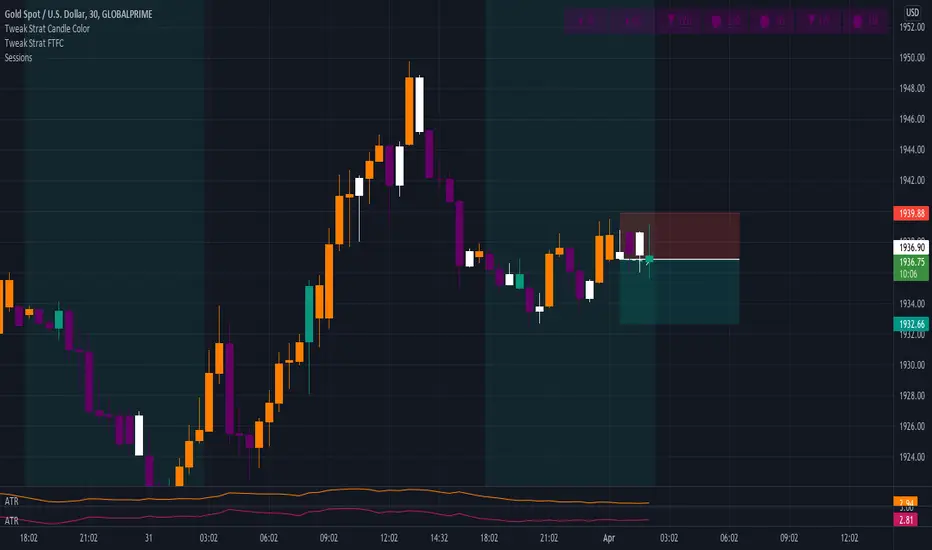
This script allows traders to view timeframe continuity on 7 timeframes at the top of the chart.
The trader selects 7 different timeframes, and the script will reflect whether the current candle for each timeframe is bullish or bearish (current price > the open OR current price < the open).
If a timeframe is currently bearish, the box will be purple.
If a timeframe is currently bullish, the box will be orange.
A circle in the middle of the box indicates that that timeframe is currently an inside bar (1).
An upward arrow indicates that that timeframe is currently a directional up bar (2u).
A downward arrow indicates that that timeframe is currently a directional down bar (2d).
A rectangle indicates that that timeframe is currently an outside bar (3).
NOTE: The color of the boxes is fixed. Traders MUST select a timeframe for EACH OF THE 7 FIELDS.
보호된 스크립트입니다
이 스크립트는 비공개 소스로 게시됩니다. 하지만 이를 자유롭게 제한 없이 사용할 수 있습니다 – 자세한 내용은 여기에서 확인하세요.
면책사항
해당 정보와 게시물은 금융, 투자, 트레이딩 또는 기타 유형의 조언이나 권장 사항으로 간주되지 않으며, 트레이딩뷰에서 제공하거나 보증하는 것이 아닙니다. 자세한 내용은 이용 약관을 참조하세요.
면책사항
해당 정보와 게시물은 금융, 투자, 트레이딩 또는 기타 유형의 조언이나 권장 사항으로 간주되지 않으며, 트레이딩뷰에서 제공하거나 보증하는 것이 아닙니다. 자세한 내용은 이용 약관을 참조하세요.