INVITE-ONLY SCRIPT
Goldbach Energy Curve
⚡ Goldbach Energy Curve (G-Energy)
Precision phase-energy detection for professional traders
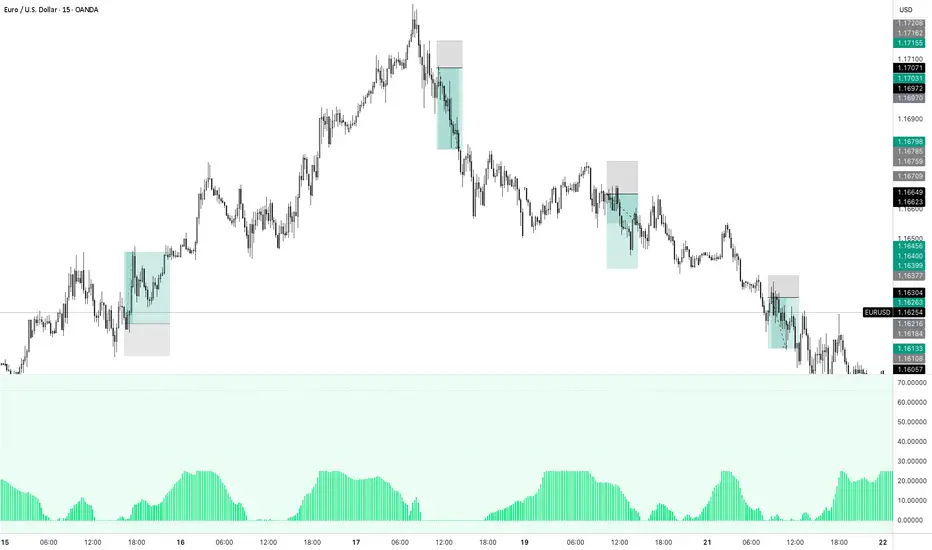
The Goldbach Energy Curve transforms raw market motion into a smooth, color-coded energy profile — revealing when price transitions between Accumulation, Manipulation, and Distribution states.
It blends advanced filtering with adaptive energy mapping to visualize market compression and expansion cycles in real time.
Use it to sense when momentum is building, fading, or rotating across phases — before structure or volume confirms the shift.
⚙️ How to Read the Energy Curve
Below 10 → Ultra-Low Energy Zone
Market in deep Accumulation — liquidity builds, volatility compresses, and smart money positions quietly.
10 – 33 → Rising Accumulation
Early signs of energy release; watch for breakout or expansion setups.
33 – 66 → Manipulation Phase
Transitional zone; expect false moves, liquidity grabs, and short-term volatility spikes.
Above 66 → Distribution Phase
Energy peaks — trend exhaustion, reversals, or large-scale profit-taking often emerge.
Align your directional bias with the market’s current energy state, from silent buildup to full distribution.
Features
Dynamic A / M / D phase tracking
Smooth histogram with adaptive curve overlay
Automatic background shading for instant context
Non-repainting and optimized for multi-timeframe analysis
Ideal for:
Institutional-style traders who value precision, clarity, and early insight into phase rotations.
Precision phase-energy detection for professional traders
The Goldbach Energy Curve transforms raw market motion into a smooth, color-coded energy profile — revealing when price transitions between Accumulation, Manipulation, and Distribution states.
It blends advanced filtering with adaptive energy mapping to visualize market compression and expansion cycles in real time.
Use it to sense when momentum is building, fading, or rotating across phases — before structure or volume confirms the shift.
⚙️ How to Read the Energy Curve
Below 10 → Ultra-Low Energy Zone
Market in deep Accumulation — liquidity builds, volatility compresses, and smart money positions quietly.
10 – 33 → Rising Accumulation
Early signs of energy release; watch for breakout or expansion setups.
33 – 66 → Manipulation Phase
Transitional zone; expect false moves, liquidity grabs, and short-term volatility spikes.
Above 66 → Distribution Phase
Energy peaks — trend exhaustion, reversals, or large-scale profit-taking often emerge.
Align your directional bias with the market’s current energy state, from silent buildup to full distribution.
Features
Dynamic A / M / D phase tracking
Smooth histogram with adaptive curve overlay
Automatic background shading for instant context
Non-repainting and optimized for multi-timeframe analysis
Ideal for:
Institutional-style traders who value precision, clarity, and early insight into phase rotations.
초대 전용 스크립트
이 스크립트는 작성자가 승인한 사용자만 접근할 수 있습니다. 사용하려면 요청 후 승인을 받아야 하며, 일반적으로 결제 후에 허가가 부여됩니다. 자세한 내용은 아래 작성자의 안내를 따르거나 zacdivan에게 직접 문의하세요.
트레이딩뷰는 스크립트의 작동 방식을 충분히 이해하고 작성자를 완전히 신뢰하지 않는 이상, 해당 스크립트에 비용을 지불하거나 사용하는 것을 권장하지 않습니다. 커뮤니티 스크립트에서 무료 오픈소스 대안을 찾아보실 수도 있습니다.
작성자 지시 사항
The Goldbach Energy Curve exposes hidden energy transitions in real time.
Watch how accumulation builds before breakout and distribution forms before reversal.
For exclusive invite access and community updates:https://t.me/zacdivan
면책사항
해당 정보와 게시물은 금융, 투자, 트레이딩 또는 기타 유형의 조언이나 권장 사항으로 간주되지 않으며, 트레이딩뷰에서 제공하거나 보증하는 것이 아닙니다. 자세한 내용은 이용 약관을 참조하세요.