OPEN-SOURCE SCRIPT
ka66: Volatility Momentum
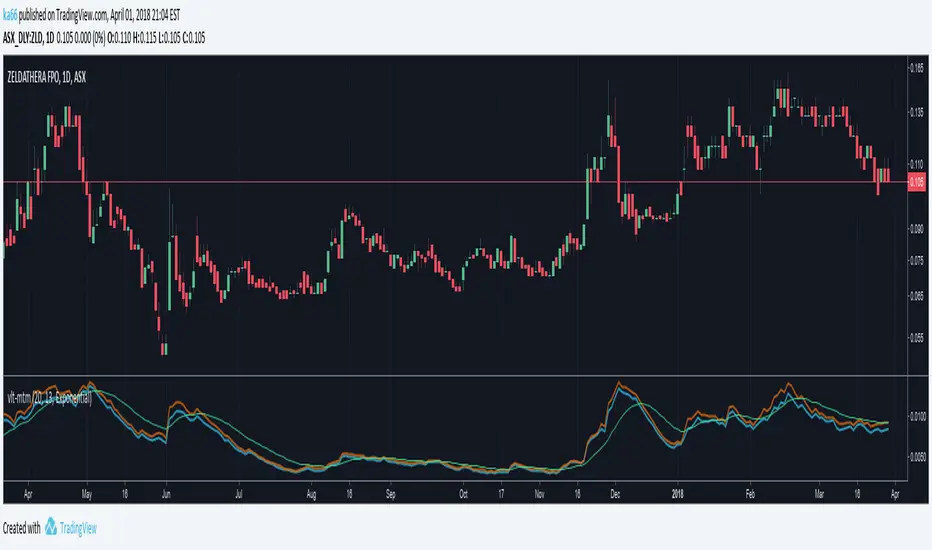
This is a 'monitoring' indicator to see if an instrument is viable enough to be traded, by virtue of volatility (or lack of volatility in context may lead to a break out), or may become so. It shows the following information:
Price Range (high - low) averaged across a set of bars: Useful gauging potential trading profits. This was its initial goal, to not measure bars manually!
ATR: As a comparison point for the price range above. Divergence between true range (TR) and plain price range might signal volatility changes occurring in the instrument.
Signal volatility line: a moving average of the larger of the average price range and ATR. This takes inspiration from other indicators like MACD and Stochastic, and is a way of comparing change in recent volatility --- this achieves the momentum part. The larger was chosen to keep things simple, and not have a signal line per range!
avgRange = movingAvg(high - low, avgPeriod)
atr = movingAvg(trueRange, avgPeriod)
signal = movingAvg(max(avgRange, atr), avgPeriod)
Configurable periods and averaging mechanism.
오픈 소스 스크립트
트레이딩뷰의 진정한 정신에 따라, 이 스크립트의 작성자는 이를 오픈소스로 공개하여 트레이더들이 기능을 검토하고 검증할 수 있도록 했습니다. 작성자에게 찬사를 보냅니다! 이 코드는 무료로 사용할 수 있지만, 코드를 재게시하는 경우 하우스 룰이 적용된다는 점을 기억하세요.
면책사항
해당 정보와 게시물은 금융, 투자, 트레이딩 또는 기타 유형의 조언이나 권장 사항으로 간주되지 않으며, 트레이딩뷰에서 제공하거나 보증하는 것이 아닙니다. 자세한 내용은 이용 약관을 참조하세요.
오픈 소스 스크립트
트레이딩뷰의 진정한 정신에 따라, 이 스크립트의 작성자는 이를 오픈소스로 공개하여 트레이더들이 기능을 검토하고 검증할 수 있도록 했습니다. 작성자에게 찬사를 보냅니다! 이 코드는 무료로 사용할 수 있지만, 코드를 재게시하는 경우 하우스 룰이 적용된다는 점을 기억하세요.
면책사항
해당 정보와 게시물은 금융, 투자, 트레이딩 또는 기타 유형의 조언이나 권장 사항으로 간주되지 않으며, 트레이딩뷰에서 제공하거나 보증하는 것이 아닙니다. 자세한 내용은 이용 약관을 참조하세요.