OPEN-SOURCE SCRIPT
업데이트됨 Isolated Peak and Bottom (Tuncer ŞENGÖZ) by KıvanÇ fr3762
This Technique is created by Tuncer Şengöz @TuncerSengoz on twitter
An uptrend with higher highs might not make new highs everyday. So how could we define the end of an uptrend? How could we tell the difference between the end of an uptrend and a temporary correction? This isolated high/low technique aims to help us in this kind of situations.
We call the highest point of an uptrend until the particular day “an isolated Peak” and consider the lowest point of the day before as a signal level. If the signal level is broken in 2 days, we assume the uptrend to be over. If it is not broken in 2 days, the uptrend continues. The same technique also applies to a downtrend and the only difference would be the direction.
conversely it has the same logic of finding an end of a downtrend, called "Isolated Bottom" which can be considered the highest point of the day before as a signal level the same way.
The success rate of this technique is quite high (around 85%). There is no required term for this technique and it can be used in yearly, daily or ticker charts, because the market moves in fractals and repeats itself in every scale.
As in every technique, it might also give false signals in some situations like extreme volatility or emotional decisions of masses. However, it will be very helpful for us to indicate the direction of a trend.
Creator: Tuncer ŞENGÖZ @TuncerSengoz on twitter
릴리즈 노트
formula updated릴리즈 노트
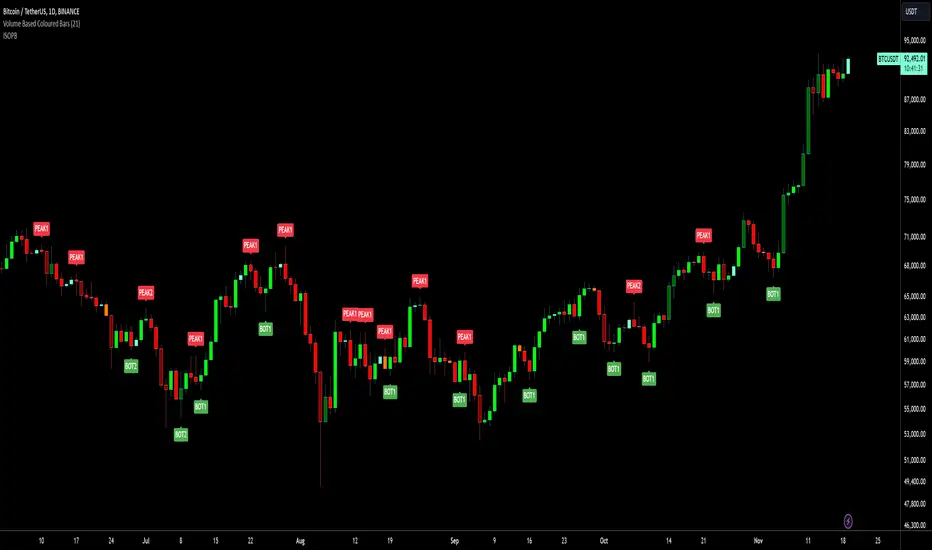
PEAK1: Isolated Peak conditions occured 1 bar after the peakPEAK2: Isolated Peak conditions occured 2 bars after the peak
BOT1: Isolated Bottom conditions occured 1 bar after the bottom
BOT2: Isolated Bottom conditions occured 2 bars after the bottom
릴리즈 노트
addded alarms and code updated to V6오픈 소스 스크립트
트레이딩뷰의 진정한 정신에 따라, 이 스크립트의 작성자는 이를 오픈소스로 공개하여 트레이더들이 기능을 검토하고 검증할 수 있도록 했습니다. 작성자에게 찬사를 보냅니다! 이 코드는 무료로 사용할 수 있지만, 코드를 재게시하는 경우 하우스 룰이 적용된다는 점을 기억하세요.
Telegram t.me/AlgoRhytm
YouTube (Turkish): youtube.com/c/kivancozbilgic
YouTube (English): youtube.com/c/AlgoWorld
YouTube (Turkish): youtube.com/c/kivancozbilgic
YouTube (English): youtube.com/c/AlgoWorld
면책사항
해당 정보와 게시물은 금융, 투자, 트레이딩 또는 기타 유형의 조언이나 권장 사항으로 간주되지 않으며, 트레이딩뷰에서 제공하거나 보증하는 것이 아닙니다. 자세한 내용은 이용 약관을 참조하세요.
오픈 소스 스크립트
트레이딩뷰의 진정한 정신에 따라, 이 스크립트의 작성자는 이를 오픈소스로 공개하여 트레이더들이 기능을 검토하고 검증할 수 있도록 했습니다. 작성자에게 찬사를 보냅니다! 이 코드는 무료로 사용할 수 있지만, 코드를 재게시하는 경우 하우스 룰이 적용된다는 점을 기억하세요.
Telegram t.me/AlgoRhytm
YouTube (Turkish): youtube.com/c/kivancozbilgic
YouTube (English): youtube.com/c/AlgoWorld
YouTube (Turkish): youtube.com/c/kivancozbilgic
YouTube (English): youtube.com/c/AlgoWorld
면책사항
해당 정보와 게시물은 금융, 투자, 트레이딩 또는 기타 유형의 조언이나 권장 사항으로 간주되지 않으며, 트레이딩뷰에서 제공하거나 보증하는 것이 아닙니다. 자세한 내용은 이용 약관을 참조하세요.