OPEN-SOURCE SCRIPT
Covering Shadow Candle Pattern
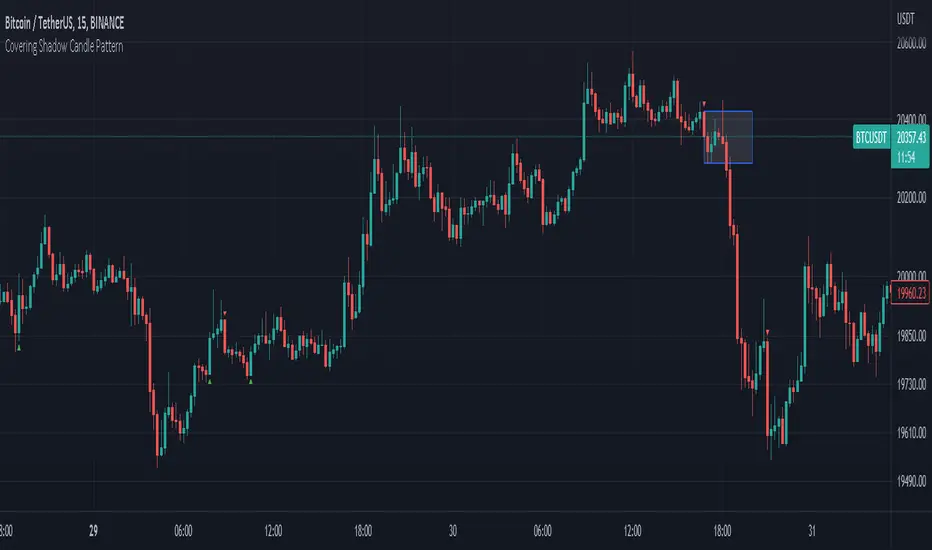
This indicator shows 3 types of objects on chart:
1. downward red triangle above a candle: 3 green candles followed by a fourth red candle of which the low price is lower than the low of the 3 previous green candles, this is usually the sign of reversal from upward movement to a downward one.
2. 1. upward green triangle below a candle: 3 red candles followed by a fourth green candle of which the high price is higher than the high of the 3 previous red candles, this is usually the sign of reversal from downward movement to a upward one.
3. boxes: these boxes are drawn when the patterns of cases 1 and 2 fails to perform as expected which means we have some important areas at that level so it can be a resistance or support zone .
오픈 소스 스크립트
트레이딩뷰의 진정한 정신에 따라, 이 스크립트의 작성자는 이를 오픈소스로 공개하여 트레이더들이 기능을 검토하고 검증할 수 있도록 했습니다. 작성자에게 찬사를 보냅니다! 이 코드는 무료로 사용할 수 있지만, 코드를 재게시하는 경우 하우스 룰이 적용된다는 점을 기억하세요.
면책사항
해당 정보와 게시물은 금융, 투자, 트레이딩 또는 기타 유형의 조언이나 권장 사항으로 간주되지 않으며, 트레이딩뷰에서 제공하거나 보증하는 것이 아닙니다. 자세한 내용은 이용 약관을 참조하세요.
오픈 소스 스크립트
트레이딩뷰의 진정한 정신에 따라, 이 스크립트의 작성자는 이를 오픈소스로 공개하여 트레이더들이 기능을 검토하고 검증할 수 있도록 했습니다. 작성자에게 찬사를 보냅니다! 이 코드는 무료로 사용할 수 있지만, 코드를 재게시하는 경우 하우스 룰이 적용된다는 점을 기억하세요.
면책사항
해당 정보와 게시물은 금융, 투자, 트레이딩 또는 기타 유형의 조언이나 권장 사항으로 간주되지 않으며, 트레이딩뷰에서 제공하거나 보증하는 것이 아닙니다. 자세한 내용은 이용 약관을 참조하세요.