OPEN-SOURCE SCRIPT
Weekly Open to Close Percentage Change
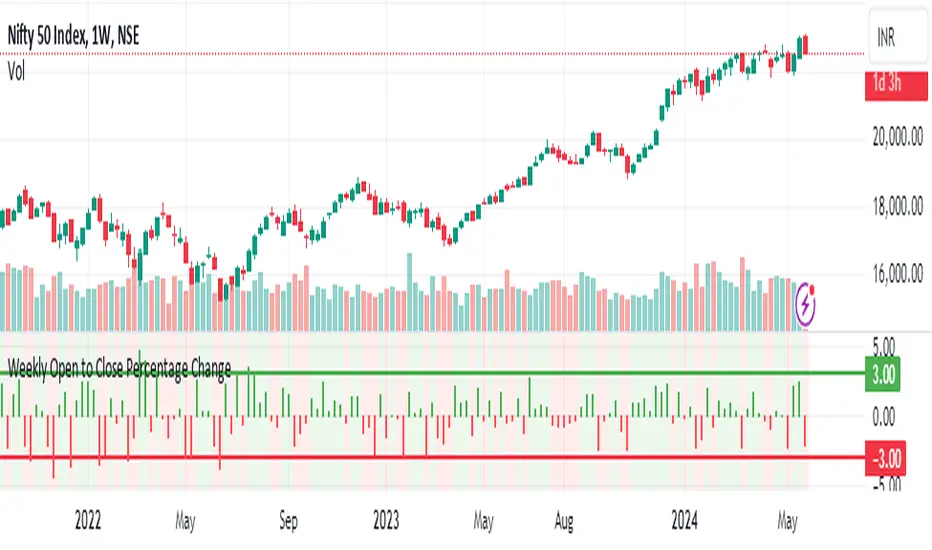
The "Weekly Open to Close Percentage Change Indicator" is a powerful tool designed to help traders and investors track the percentage change in price from the open of the current week's candle to its close. This indicator provides a clear visualization of how the price has moved within the week, offering valuable insights into weekly market trends and momentum.
Key Features:
Weekly Analysis: Focuses on weekly time frames, making it ideal for swing traders and long-term investors.
Percentage Change Calculation: Accurately calculates the percentage change from the open price of the current week's candle to the close price.
Color-Coded Visualization: Uses color coding to differentiate between positive and negative changes:
Green for positive percentage changes (price increase).
Red for negative percentage changes (price decrease).
Histogram Display: Plots the percentage change as a histogram for easy visual interpretation.
Background Highlighting: Adds a background color with transparency to highlight the nature of the change, enhancing chart readability.
Optional Labels: Includes an option to display percentage change values as small dots at the top for quick reference.
How to Use:
Add the script to your TradingView chart by opening the Pine Editor, pasting the script, and saving it.
Apply the indicator to your chart. It will automatically calculate and display the weekly percentage change.
Use the color-coded histogram and background to quickly assess weekly price movements and make informed trading decisions.
Use Cases:
Trend Identification: Quickly identify whether the market is trending upwards or downwards on a weekly basis.
Market Sentiment: Gauge the market sentiment by observing the weekly price changes.
Swing Trading: Ideal for swing traders who base their strategies on weekly price movements.
Note: This indicator is designed for educational and informational purposes. Always conduct thorough analysis and consider multiple indicators and factors when making trading decisions.
오픈 소스 스크립트
트레이딩뷰의 진정한 정신에 따라, 이 스크립트의 작성자는 이를 오픈소스로 공개하여 트레이더들이 기능을 검토하고 검증할 수 있도록 했습니다. 작성자에게 찬사를 보냅니다! 이 코드는 무료로 사용할 수 있지만, 코드를 재게시하는 경우 하우스 룰이 적용된다는 점을 기억하세요.
면책사항
해당 정보와 게시물은 금융, 투자, 트레이딩 또는 기타 유형의 조언이나 권장 사항으로 간주되지 않으며, 트레이딩뷰에서 제공하거나 보증하는 것이 아닙니다. 자세한 내용은 이용 약관을 참조하세요.
오픈 소스 스크립트
트레이딩뷰의 진정한 정신에 따라, 이 스크립트의 작성자는 이를 오픈소스로 공개하여 트레이더들이 기능을 검토하고 검증할 수 있도록 했습니다. 작성자에게 찬사를 보냅니다! 이 코드는 무료로 사용할 수 있지만, 코드를 재게시하는 경우 하우스 룰이 적용된다는 점을 기억하세요.
면책사항
해당 정보와 게시물은 금융, 투자, 트레이딩 또는 기타 유형의 조언이나 권장 사항으로 간주되지 않으며, 트레이딩뷰에서 제공하거나 보증하는 것이 아닙니다. 자세한 내용은 이용 약관을 참조하세요.