OPEN-SOURCE SCRIPT
업데이트됨 Stablecoin supplies [USD bn]
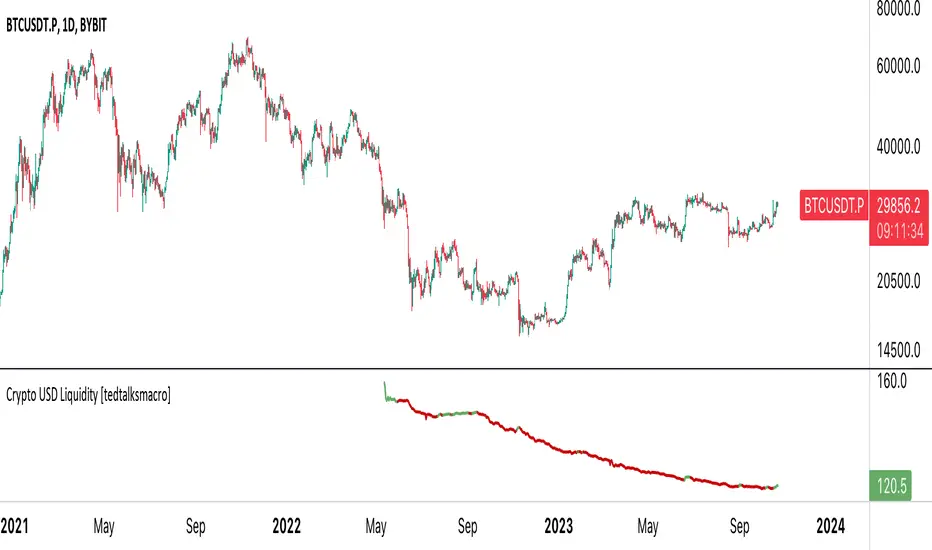
This script shows crypto market inflows/outflows by showing the USD stablecoin supplies, using data from https://glassnode.com/:
 BUSD_SUPPLY
 USDT_SUPPLY
 USDC_SUPPLY
Using a simple 20 EMA, the line will change color showing stablecoin inflow or outflow. Traders can consider stable coin inflows (green) as bullish for Bitcoin price, while stable coin outflows (red) should be considered bearish for price.
Using a simple 20 EMA, the line will change color showing stablecoin inflow or outflow. Traders can consider stable coin inflows (green) as bullish for Bitcoin price, while stable coin outflows (red) should be considered bearish for price.
릴리즈 노트
Script title update릴리즈 노트
Designed to visualize the total liquidity of major stablecoins in the cryptocurrency market. The liquidity is calculated by summing the supply values of five leading stablecoins: USDT, BUSD, USDC, DAI, and TUSD. Based on the comparison of the current liquidity value with its EMA, the script colors the plotted line either green (when above the EMA) or red (when below the EMA), helping traders visually identify bullish or bearish liquidity trends.
오픈 소스 스크립트
트레이딩뷰의 진정한 정신에 따라, 이 스크립트의 작성자는 이를 오픈소스로 공개하여 트레이더들이 기능을 검토하고 검증할 수 있도록 했습니다. 작성자에게 찬사를 보냅니다! 이 코드는 무료로 사용할 수 있지만, 코드를 재게시하는 경우 하우스 룰이 적용된다는 점을 기억하세요.
면책사항
해당 정보와 게시물은 금융, 투자, 트레이딩 또는 기타 유형의 조언이나 권장 사항으로 간주되지 않으며, 트레이딩뷰에서 제공하거나 보증하는 것이 아닙니다. 자세한 내용은 이용 약관을 참조하세요.
오픈 소스 스크립트
트레이딩뷰의 진정한 정신에 따라, 이 스크립트의 작성자는 이를 오픈소스로 공개하여 트레이더들이 기능을 검토하고 검증할 수 있도록 했습니다. 작성자에게 찬사를 보냅니다! 이 코드는 무료로 사용할 수 있지만, 코드를 재게시하는 경우 하우스 룰이 적용된다는 점을 기억하세요.
면책사항
해당 정보와 게시물은 금융, 투자, 트레이딩 또는 기타 유형의 조언이나 권장 사항으로 간주되지 않으며, 트레이딩뷰에서 제공하거나 보증하는 것이 아닙니다. 자세한 내용은 이용 약관을 참조하세요.