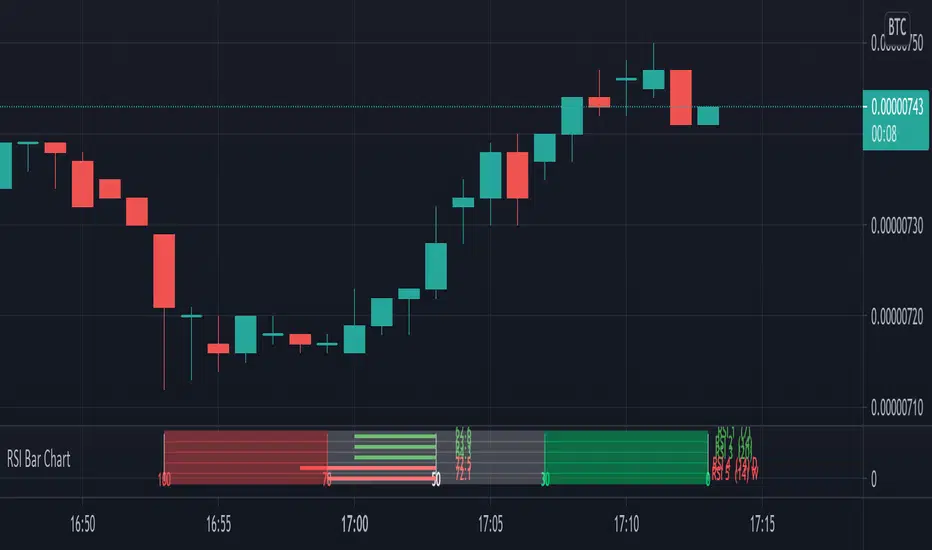
A different way to plot several RSI at once,
5 RSI with different options:
- source, length, timeframe
- size of indicator (width)
- color change
- limit change (30, 70), labels will be changed accordingly
- type of RSI line (line, arrow), linewidth
- offset label (at the right)
There are 4 colors (RSI line)
- when RSI > sell limit
- when RSI > 50 but below sell limit
- when RSI < 50 but above buy limit
- when RSI < buy limit


Arrows:

Different size:


Cheers!
5 RSI with different options:
- source, length, timeframe
- size of indicator (width)
- color change
- limit change (30, 70), labels will be changed accordingly
- type of RSI line (line, arrow), linewidth
- offset label (at the right)
There are 4 colors (RSI line)
- when RSI > sell limit
- when RSI > 50 but below sell limit
- when RSI < 50 but above buy limit
- when RSI < buy limit
Arrows:
Different size:
Cheers!
릴리즈 노트
Now every number (label) is changed when the label size is adjustedAlso shortened the script by adding f_rsi()
릴리즈 노트
Small bug fix -> labels at the right are now visible on symbols sessions that stop in the weekend릴리즈 노트
Blurry text/lines fix릴리즈 노트
Update오픈 소스 스크립트
트레이딩뷰의 진정한 정신에 따라, 이 스크립트의 작성자는 이를 오픈소스로 공개하여 트레이더들이 기능을 검토하고 검증할 수 있도록 했습니다. 작성자에게 찬사를 보냅니다! 이 코드는 무료로 사용할 수 있지만, 코드를 재게시하는 경우 하우스 룰이 적용된다는 점을 기억하세요.
Who are PineCoders?
tradingview.com/chart/SSP/yW5eOqtm-Who-are-PineCoders/
TG Pine Script® Q&A: t.me/PineCodersQA
- We cannot control our emotions,
but we can control our keyboard -
tradingview.com/chart/SSP/yW5eOqtm-Who-are-PineCoders/
TG Pine Script® Q&A: t.me/PineCodersQA
- We cannot control our emotions,
but we can control our keyboard -
면책사항
해당 정보와 게시물은 금융, 투자, 트레이딩 또는 기타 유형의 조언이나 권장 사항으로 간주되지 않으며, 트레이딩뷰에서 제공하거나 보증하는 것이 아닙니다. 자세한 내용은 이용 약관을 참조하세요.
오픈 소스 스크립트
트레이딩뷰의 진정한 정신에 따라, 이 스크립트의 작성자는 이를 오픈소스로 공개하여 트레이더들이 기능을 검토하고 검증할 수 있도록 했습니다. 작성자에게 찬사를 보냅니다! 이 코드는 무료로 사용할 수 있지만, 코드를 재게시하는 경우 하우스 룰이 적용된다는 점을 기억하세요.
Who are PineCoders?
tradingview.com/chart/SSP/yW5eOqtm-Who-are-PineCoders/
TG Pine Script® Q&A: t.me/PineCodersQA
- We cannot control our emotions,
but we can control our keyboard -
tradingview.com/chart/SSP/yW5eOqtm-Who-are-PineCoders/
TG Pine Script® Q&A: t.me/PineCodersQA
- We cannot control our emotions,
but we can control our keyboard -
면책사항
해당 정보와 게시물은 금융, 투자, 트레이딩 또는 기타 유형의 조언이나 권장 사항으로 간주되지 않으며, 트레이딩뷰에서 제공하거나 보증하는 것이 아닙니다. 자세한 내용은 이용 약관을 참조하세요.