OPEN-SOURCE SCRIPT
Momentum Scope

Overview
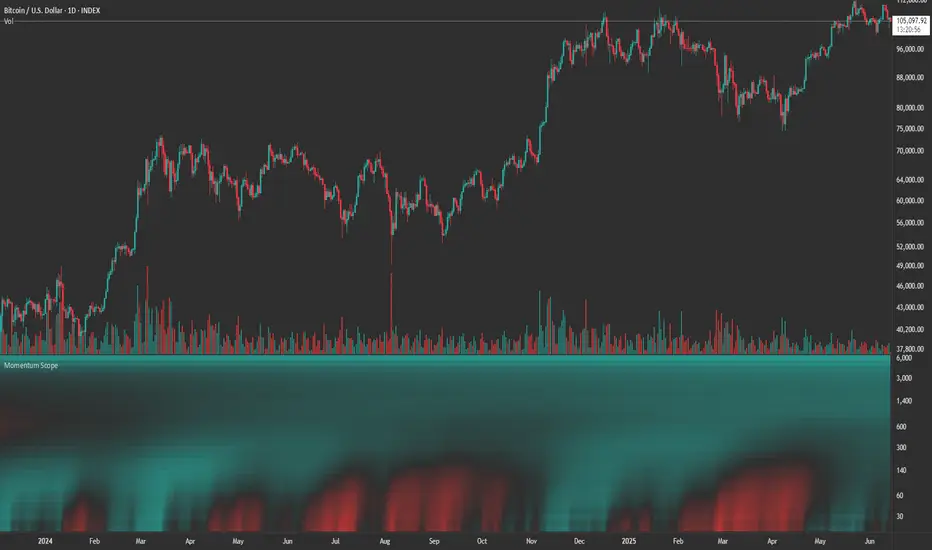
Momentum Scope is a Pine Script™ v6 study that renders a –1 to +1 momentum heatmap across up to 32 lookback periods in its own pane. Using an Augmented Relative Momentum Index (ARMI) and color shading, it highlights where momentum strengthens, weakens, or stays flat over time—across any asset and timeframe.
Key Features
Inputs & Customization
How to Use
Copyright © 2025 MVPMC. Licensed under MIT. For full license see opensource.org/licenses/MIT
Momentum Scope is a Pine Script™ v6 study that renders a –1 to +1 momentum heatmap across up to 32 lookback periods in its own pane. Using an Augmented Relative Momentum Index (ARMI) and color shading, it highlights where momentum strengthens, weakens, or stays flat over time—across any asset and timeframe.
Key Features
- Full-Spectrum Momentum Map: Computes ARMI for 1–32 lookbacks, indexed from –1 (strong bearish) to +1 (strong bullish).
- Flexible Scale Gradation: Choose Linear or Exponential spacing, with adjustable expansion ratio and maximum depth.
- Trending Bias Control: Apply a contrast-style curve transform to emphasize trending vs. mean-reverting behavior.
- Duotone & Tritone Palettes: Select between two vivid color styles, with user-definable hues for bearish, bullish, and neutral momentum.
- Compact, Overlay-Free Display: Renders solely in its own pane—keeping your price chart clean.
Inputs & Customization
- Scale Gradation: Linear or Exponential spacing of intervals
- Scale Expansion: Ratio governing step-size between successive lookbacks
- Scale Maximum: Maximum lookback period (and highest interval)
- Trending Bias: Curve-transform bias to tilt the –1 … +1 grid
- Color Style: Duotone or Tritone rendering modes
- Reducing / Increasing / Neutral Colors: Pick your own hues for bearish, bullish, and flat zones
How to Use
- Add to Chart: Apply “Momentum Scope” as a separate indicator.
- Adjust Scale: For exponential spacing, switch your indicator Y-axis to Logarithmic.
- Set Bias & Colors: Tweak Trending Bias and choose a palette that stands out on your layout.
- Interpret the Heatmap:
- Red tones = weakening/bearish momentum
- Green tones = strengthening/bullish momentum
- Neutral hues = indecision or flat momentum
- Red tones = weakening/bearish momentum
Copyright © 2025 MVPMC. Licensed under MIT. For full license see opensource.org/licenses/MIT
오픈 소스 스크립트
트레이딩뷰의 진정한 정신에 따라, 이 스크립트의 작성자는 이를 오픈소스로 공개하여 트레이더들이 기능을 검토하고 검증할 수 있도록 했습니다. 작성자에게 찬사를 보냅니다! 이 코드는 무료로 사용할 수 있지만, 코드를 재게시하는 경우 하우스 룰이 적용된다는 점을 기억하세요.
MVPMC
면책사항
해당 정보와 게시물은 금융, 투자, 트레이딩 또는 기타 유형의 조언이나 권장 사항으로 간주되지 않으며, 트레이딩뷰에서 제공하거나 보증하는 것이 아닙니다. 자세한 내용은 이용 약관을 참조하세요.
오픈 소스 스크립트
트레이딩뷰의 진정한 정신에 따라, 이 스크립트의 작성자는 이를 오픈소스로 공개하여 트레이더들이 기능을 검토하고 검증할 수 있도록 했습니다. 작성자에게 찬사를 보냅니다! 이 코드는 무료로 사용할 수 있지만, 코드를 재게시하는 경우 하우스 룰이 적용된다는 점을 기억하세요.
MVPMC
면책사항
해당 정보와 게시물은 금융, 투자, 트레이딩 또는 기타 유형의 조언이나 권장 사항으로 간주되지 않으며, 트레이딩뷰에서 제공하거나 보증하는 것이 아닙니다. 자세한 내용은 이용 약관을 참조하세요.