OPEN-SOURCE SCRIPT
Distance from MA (%)
Purpose:
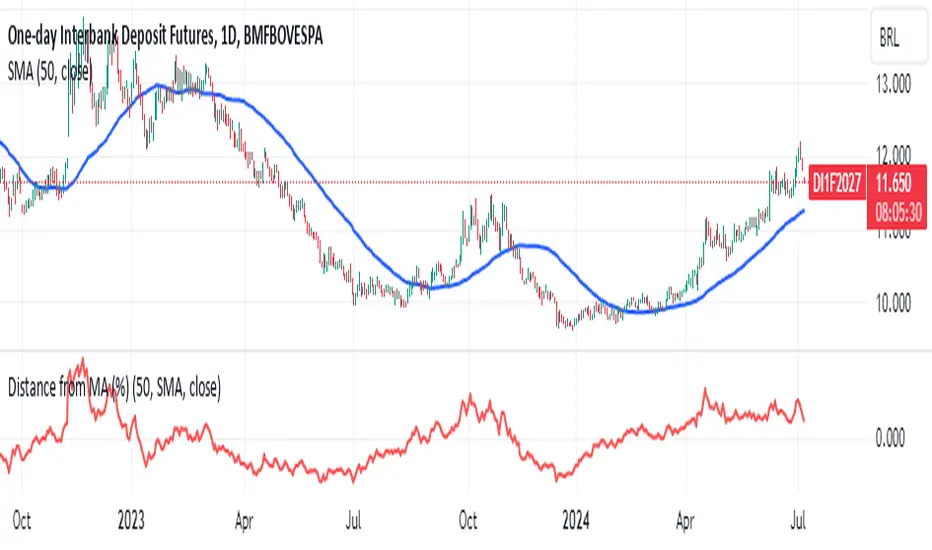
This indicator calculates and plots the distance in percentage between the current price and a specified moving average. The distance is displayed in a separate window below the main price chart.
Features:
Configurable Moving Average Period: You can set the period for the moving average calculation.
Multiple Moving Average Methods: The indicator supports various moving average methods, including Simple Moving Average (SMA), Exponential Moving Average (EMA), Weighted Moving Average (WMA), and Volume Weighted Moving Average (VWMA).
Applied Price Selection: You can choose which price to use for the moving average calculation (e.g., close, open, high, low, etc.).
Parameters:
MA Period: The number of periods to use for the moving average calculation.
MA Method: The type of moving average to use (SMA, EMA, WMA, VWMA).
Applied Price: The price used for the moving average calculation.
Calculation:
Moving Average Calculation:
Depending on the selected method, the indicator calculates the moving average (MA) value for each bar using the specified period and applied price.
Distance in Percentage:
The distance is calculated as the difference between the current price and the moving average value, divided by the moving average value, and then multiplied by 100 to convert it to a percentage.
Formula: Distance %=(Applied Price−MA ValueMA Value)×100Distance %=(MA ValueApplied Price−MA Value)×100
Plotting:
The indicator plots the calculated distance in percentage as a line in a separate window below the main chart. The plot is colored red and has a linewidth of 2 for better visibility.
오픈 소스 스크립트
트레이딩뷰의 진정한 정신에 따라, 이 스크립트의 작성자는 이를 오픈소스로 공개하여 트레이더들이 기능을 검토하고 검증할 수 있도록 했습니다. 작성자에게 찬사를 보냅니다! 이 코드는 무료로 사용할 수 있지만, 코드를 재게시하는 경우 하우스 룰이 적용된다는 점을 기억하세요.
면책사항
해당 정보와 게시물은 금융, 투자, 트레이딩 또는 기타 유형의 조언이나 권장 사항으로 간주되지 않으며, 트레이딩뷰에서 제공하거나 보증하는 것이 아닙니다. 자세한 내용은 이용 약관을 참조하세요.
오픈 소스 스크립트
트레이딩뷰의 진정한 정신에 따라, 이 스크립트의 작성자는 이를 오픈소스로 공개하여 트레이더들이 기능을 검토하고 검증할 수 있도록 했습니다. 작성자에게 찬사를 보냅니다! 이 코드는 무료로 사용할 수 있지만, 코드를 재게시하는 경우 하우스 룰이 적용된다는 점을 기억하세요.
면책사항
해당 정보와 게시물은 금융, 투자, 트레이딩 또는 기타 유형의 조언이나 권장 사항으로 간주되지 않으며, 트레이딩뷰에서 제공하거나 보증하는 것이 아닙니다. 자세한 내용은 이용 약관을 참조하세요.