OPEN-SOURCE SCRIPT
업데이트됨 Advanced RSI Helper

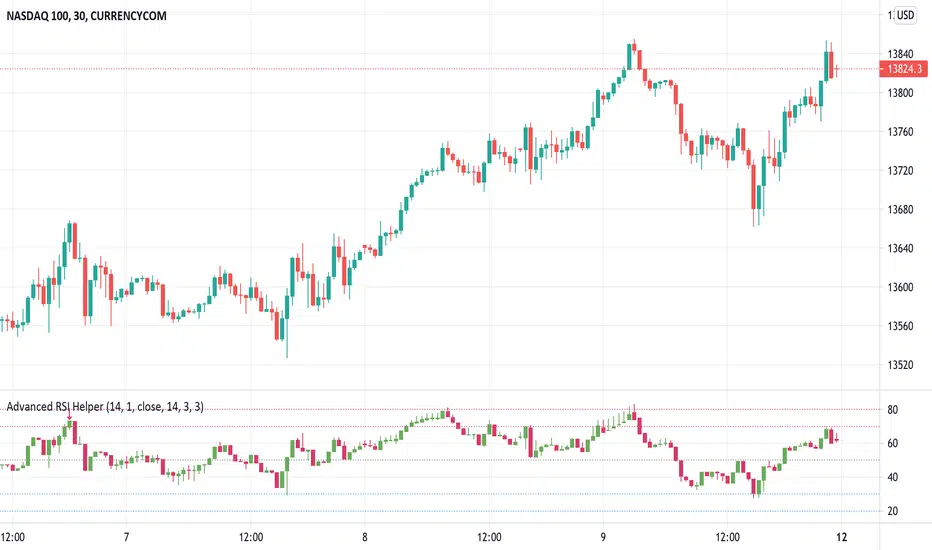
Here is Advanced RSI Helper. An advanced RSI represented in a candle type chart. It contains a Stochastic and a Pivot Detector (High-Low) and RSI divergences.
It also contains a Filter which you can configure the upper, lower zone to colorize the bars on the chart only when you are overbought or oversold, when you are in range the bars appear "transparent".
You also have the option of placing alerts for divergences or when the rsi exceeds the upper zone 1 / 2 or lower zone 1 / 2.
if you encounter any bugs do not hesitate to let me know in the comment area. The same goes for your suggestions.
Cheers and remember, risk management is the most important!
릴리즈 노트
-Bug fix.릴리즈 노트
-Minor improvement.릴리즈 노트
-Minor improvements.릴리즈 노트
-Displaced the "RSI Filter Bar Color" into my other indicator "Rain On Me PRO 1/3" cause it was making conflict with it when used together.릴리즈 노트
-Less "flashy" Bar Color.릴리즈 노트
-Minor improvements.릴리즈 노트
-New option added "Show RSI Meter" in setting. That will help newbie to understand RSI fundamentals and can show you easily the RSI state in one look :)Thank to all for your supports!
릴리즈 노트
-Code cleaning and minor improvements.릴리즈 노트
-Minor improvement.릴리즈 노트
-Removed "RSI Meter" cause it need display improvement.오픈 소스 스크립트
트레이딩뷰의 진정한 정신에 따라, 이 스크립트의 작성자는 이를 오픈소스로 공개하여 트레이더들이 기능을 검토하고 검증할 수 있도록 했습니다. 작성자에게 찬사를 보냅니다! 이 코드는 무료로 사용할 수 있지만, 코드를 재게시하는 경우 하우스 룰이 적용된다는 점을 기억하세요.
Telegram: t.me/+erb2pUEsHc43NmRk
E-mail: support@ricksimpsontrading.com
E-mail: support@ricksimpsontrading.com
면책사항
해당 정보와 게시물은 금융, 투자, 트레이딩 또는 기타 유형의 조언이나 권장 사항으로 간주되지 않으며, 트레이딩뷰에서 제공하거나 보증하는 것이 아닙니다. 자세한 내용은 이용 약관을 참조하세요.
오픈 소스 스크립트
트레이딩뷰의 진정한 정신에 따라, 이 스크립트의 작성자는 이를 오픈소스로 공개하여 트레이더들이 기능을 검토하고 검증할 수 있도록 했습니다. 작성자에게 찬사를 보냅니다! 이 코드는 무료로 사용할 수 있지만, 코드를 재게시하는 경우 하우스 룰이 적용된다는 점을 기억하세요.
Telegram: t.me/+erb2pUEsHc43NmRk
E-mail: support@ricksimpsontrading.com
E-mail: support@ricksimpsontrading.com
면책사항
해당 정보와 게시물은 금융, 투자, 트레이딩 또는 기타 유형의 조언이나 권장 사항으로 간주되지 않으며, 트레이딩뷰에서 제공하거나 보증하는 것이 아닙니다. 자세한 내용은 이용 약관을 참조하세요.