OPEN-SOURCE SCRIPT
MACD Higher TimeFrame
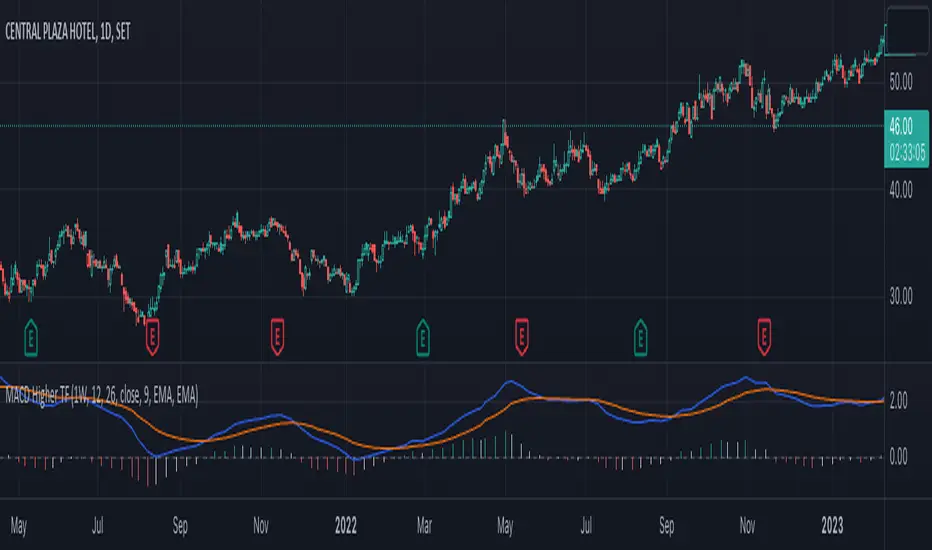
This Pine script is an indicator called "MACD Higher TimeFrame" that calculates and displays the Moving Average Convergence Divergence (MACD) on a higher timeframe. It is designed to be used on a lower timeframe chart but show the MACD values from a specified higher timeframe.
The indicator takes several inputs, including the fast length, slow length, source data, signal smoothing length, and the types of moving averages to be used for the MACD and signal lines. The default values are set to 12, 26, the closing price, 9, and exponential moving averages (EMA) for both lines, respectively. These inputs can be modified by the user.
The script calculates the MACD and signal lines based on the specified inputs and the source data. It uses the `init_ma` function to initialize the moving average calculation based on the selected moving average type (EMA or SMA) and length.
To display the MACD and signal lines from the higher timeframe, the script utilizes the `request.security` function, fetching the values of MACD and signal lines one bar ago on the higher timeframe. It handles any gaps in data and lookahead considerations.
The script also includes a function called `int_htf_fillna`, which handles the filling of `na` (not available) values for the higher timeframe indicators. It ensures that the indicator values are carried forward if they are not available for a particular bar.
To enhance the visualization, the script includes customizable colors for the MACD line, signal line, and histogram bars. The histogram bars are styled using the `plot.style_columns` option, and their color is determined by the `color_handle_ducplicate_value` function. This function checks for duplicate values and assigns colors based on whether the indicator is rising or falling, and whether it is above or below zero.
The script also includes a zero line (color #787B86) to provide a visual reference for the zero level.
Overall, this Pine script allows users to view the MACD indicator from a higher timeframe on a lower timeframe chart, providing insights into the broader market trend.
오픈 소스 스크립트
트레이딩뷰의 진정한 정신에 따라, 이 스크립트의 작성자는 이를 오픈소스로 공개하여 트레이더들이 기능을 검토하고 검증할 수 있도록 했습니다. 작성자에게 찬사를 보냅니다! 이 코드는 무료로 사용할 수 있지만, 코드를 재게시하는 경우 하우스 룰이 적용된다는 점을 기억하세요.
면책사항
해당 정보와 게시물은 금융, 투자, 트레이딩 또는 기타 유형의 조언이나 권장 사항으로 간주되지 않으며, 트레이딩뷰에서 제공하거나 보증하는 것이 아닙니다. 자세한 내용은 이용 약관을 참조하세요.
오픈 소스 스크립트
트레이딩뷰의 진정한 정신에 따라, 이 스크립트의 작성자는 이를 오픈소스로 공개하여 트레이더들이 기능을 검토하고 검증할 수 있도록 했습니다. 작성자에게 찬사를 보냅니다! 이 코드는 무료로 사용할 수 있지만, 코드를 재게시하는 경우 하우스 룰이 적용된다는 점을 기억하세요.
면책사항
해당 정보와 게시물은 금융, 투자, 트레이딩 또는 기타 유형의 조언이나 권장 사항으로 간주되지 않으며, 트레이딩뷰에서 제공하거나 보증하는 것이 아닙니다. 자세한 내용은 이용 약관을 참조하세요.