INVITE-ONLY SCRIPT
The Diamond
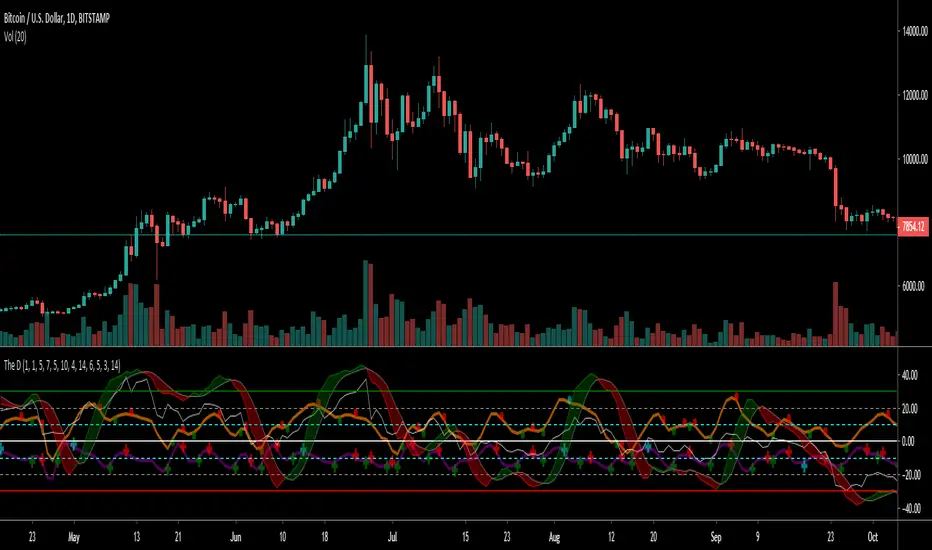
The Diamond is a collection of 3 custom oscillators and the RSI. It tries to visualizing how the momentum is increasing and decreasing and gives some buy and sell signals.
Every Line explained:
Orange line: The SMI(Swing Momentum Indicator) it is alternating oscillator between the value -10 and 40 and has its baseline at 10. It showing accumulation and increase of momentum and is used as a trend confirmation
Purple line: The BTD(Buy the Dip) is a modified Version of the SMI. It should be used in Bull or Bearflags to time entries. Also the Horizontal lines can be used as Support or Resistance
Green/Red Band: This one is a custom made stochastic. In its calculation it smoothing Tops/Lows to reduce noise. Also the look is better.
White line: Just a 14-lenght RSI. I use it together with the SMI and BTD to get confirmation
The Indicator is doing best in the crypto market. High market cap Coins/USDT Pairs do better than low market cap and btc pairs. Also it should be only used on timeframes greater than 4h. 6h and daily preferred. On higher time frames you need to adjust the values of the BTD and SMI.
Bearish divergence on both Indicators in a down trending market do give a good short entry.
Bullish divergence on the daily gives good swing entries in a downtrend
초대 전용 스크립트
이 스크립트는 작성자가 승인한 사용자만 접근할 수 있습니다. 사용하려면 요청 후 승인을 받아야 하며, 일반적으로 결제 후에 허가가 부여됩니다. 자세한 내용은 아래 작성자의 안내를 따르거나 Dawn1234에게 직접 문의하세요.
트레이딩뷰는 스크립트의 작동 방식을 충분히 이해하고 작성자를 완전히 신뢰하지 않는 이상, 해당 스크립트에 비용을 지불하거나 사용하는 것을 권장하지 않습니다. 커뮤니티 스크립트에서 무료 오픈소스 대안을 찾아보실 수도 있습니다.
작성자 지시 사항
면책사항
해당 정보와 게시물은 금융, 투자, 트레이딩 또는 기타 유형의 조언이나 권장 사항으로 간주되지 않으며, 트레이딩뷰에서 제공하거나 보증하는 것이 아닙니다. 자세한 내용은 이용 약관을 참조하세요.