PROTECTED SOURCE SCRIPT
업데이트됨 Jack Corsellis RS Line
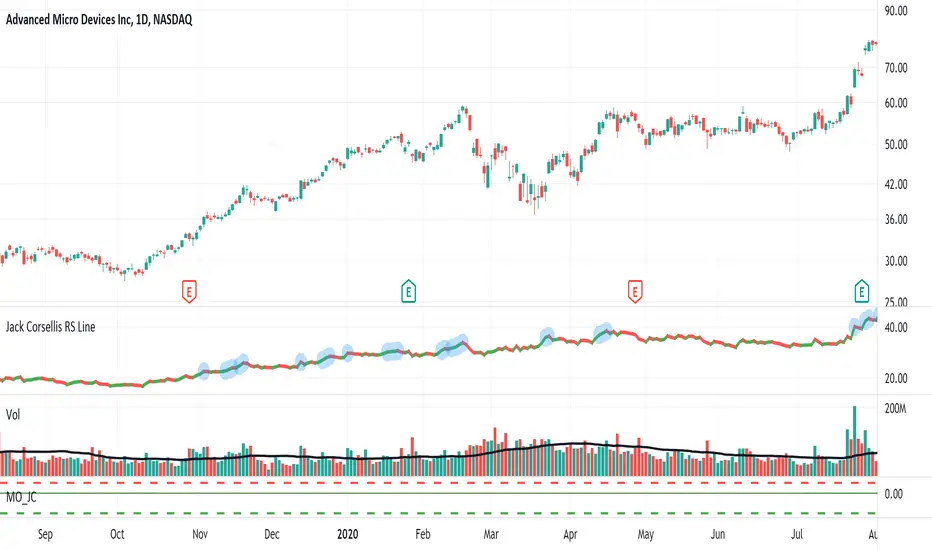
Relative Strength line which shows a blue dot for new 52 week Relative Strength highs.
릴리즈 노트
Jack Corsellis RS Line Rev 1릴리즈 노트
New update.Consistent 52 week blue dot high on daily, weekly and monthly.
No blue dots intraday.
릴리즈 노트
Revisions:1. Added the ability to plot a simple moving average (SMA) of the relative strength line.
This default is OFF (not displayed) and can be toggled ON (displayed) within the options.
The default SMA length is set to 50 days and can be configured within the options.
릴리즈 노트
Updated chart screenshot릴리즈 노트
Updated screenshot릴리즈 노트
Added Red Dot Low on Daily, Weekly and Monthly timeframes. No red dots will be displayed on intraday timeframes.Default look back period for lows is set to 52 weeks.
Indicator settings allow for this period to be configured, visibility of dot to be toggled and appearance to be changed.
보호된 스크립트입니다
이 스크립트는 비공개 소스로 게시됩니다. 하지만 이를 자유롭게 제한 없이 사용할 수 있습니다 – 자세한 내용은 여기에서 확인하세요.
면책사항
해당 정보와 게시물은 금융, 투자, 트레이딩 또는 기타 유형의 조언이나 권장 사항으로 간주되지 않으며, 트레이딩뷰에서 제공하거나 보증하는 것이 아닙니다. 자세한 내용은 이용 약관을 참조하세요.
보호된 스크립트입니다
이 스크립트는 비공개 소스로 게시됩니다. 하지만 이를 자유롭게 제한 없이 사용할 수 있습니다 – 자세한 내용은 여기에서 확인하세요.
면책사항
해당 정보와 게시물은 금융, 투자, 트레이딩 또는 기타 유형의 조언이나 권장 사항으로 간주되지 않으며, 트레이딩뷰에서 제공하거나 보증하는 것이 아닙니다. 자세한 내용은 이용 약관을 참조하세요.