OPEN-SOURCE SCRIPT
업데이트됨 Period Separator & Candle OHLC
This script combines two powerful tools for traders: period separators and custom timeframe-based OHLC (Open, High, Low, Close) data visualization. Here's what it does:
Period Separators:
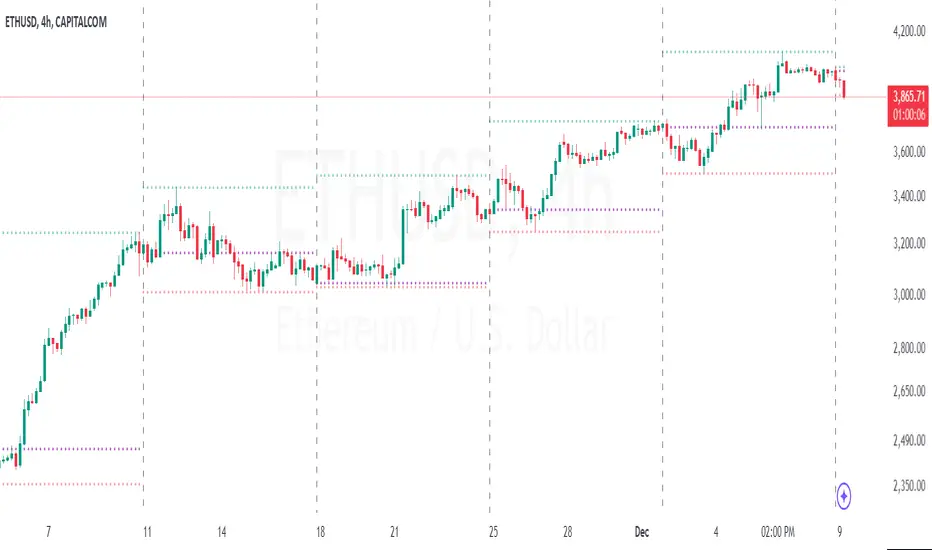
The script draws vertical lines to indicate the start of new time periods based on a user-defined timeframe (e.g., hourly, daily, weekly).
Users can customize the separator color, line style (solid, dashed, dotted), and width to suit their preferences.
Fetches OHLC data from a higher or custom timeframe (e.g., 4 hours) and overlays it on the current chart.
Users can choose to display the open, high, low, and close prices as dots or circles for easy visualization.
Optionally, the open and close dots can be visually connected with a filled bar for a candlestick-like effect.
The script color-codes the close price relative to the open (green if higher, red if lower) to highlight price direction at a glance.
Fully Customizable:
Users have full control over which OHLC values to display and whether the dots should be filled.
Transparency settings for plotted dots and fills are also adjustable for optimal visibility on different chart styles.
How It Is Useful for Trading:
Timeframe Analysis:
The period separators make it easy to distinguish trading activity across custom time intervals. This is crucial for intraday, swing, and long-term traders who analyze price movements within specific periods.
Multi-Timeframe Insights:
By overlaying OHLC data from a higher timeframe on a lower timeframe chart, traders can identify key support and resistance levels, pivots, and trends that are not immediately visible on the current timeframe.
Trend Recognition:
The color-coded close dots (green for bullish, red for bearish) provide an instant visual cue of market sentiment, helping traders confirm or refute their bias.
Whether you're a scalper, day trader, or position trader, the flexibility in timeframe selection, styling, and data presentation ensures this tool can adapt to your trading strategy.
Period Separators:
The script draws vertical lines to indicate the start of new time periods based on a user-defined timeframe (e.g., hourly, daily, weekly).
Users can customize the separator color, line style (solid, dashed, dotted), and width to suit their preferences.
Fetches OHLC data from a higher or custom timeframe (e.g., 4 hours) and overlays it on the current chart.
Users can choose to display the open, high, low, and close prices as dots or circles for easy visualization.
Optionally, the open and close dots can be visually connected with a filled bar for a candlestick-like effect.
The script color-codes the close price relative to the open (green if higher, red if lower) to highlight price direction at a glance.
Fully Customizable:
Users have full control over which OHLC values to display and whether the dots should be filled.
Transparency settings for plotted dots and fills are also adjustable for optimal visibility on different chart styles.
How It Is Useful for Trading:
Timeframe Analysis:
The period separators make it easy to distinguish trading activity across custom time intervals. This is crucial for intraday, swing, and long-term traders who analyze price movements within specific periods.
Multi-Timeframe Insights:
By overlaying OHLC data from a higher timeframe on a lower timeframe chart, traders can identify key support and resistance levels, pivots, and trends that are not immediately visible on the current timeframe.
Trend Recognition:
The color-coded close dots (green for bullish, red for bearish) provide an instant visual cue of market sentiment, helping traders confirm or refute their bias.
Whether you're a scalper, day trader, or position trader, the flexibility in timeframe selection, styling, and data presentation ensures this tool can adapt to your trading strategy.
릴리즈 노트
The indicator script has been updated to show historical and present data for the period separator lines, as well as the high and low lines. This means that you can either choose to see only the current period separator or show all past separators. I also added labels for the high and the low lines.Next update would be to implement the same logic to the open and close lines.
오픈 소스 스크립트
트레이딩뷰의 진정한 정신에 따라, 이 스크립트의 작성자는 이를 오픈소스로 공개하여 트레이더들이 기능을 검토하고 검증할 수 있도록 했습니다. 작성자에게 찬사를 보냅니다! 이 코드는 무료로 사용할 수 있지만, 코드를 재게시하는 경우 하우스 룰이 적용된다는 점을 기억하세요.
면책사항
해당 정보와 게시물은 금융, 투자, 트레이딩 또는 기타 유형의 조언이나 권장 사항으로 간주되지 않으며, 트레이딩뷰에서 제공하거나 보증하는 것이 아닙니다. 자세한 내용은 이용 약관을 참조하세요.
오픈 소스 스크립트
트레이딩뷰의 진정한 정신에 따라, 이 스크립트의 작성자는 이를 오픈소스로 공개하여 트레이더들이 기능을 검토하고 검증할 수 있도록 했습니다. 작성자에게 찬사를 보냅니다! 이 코드는 무료로 사용할 수 있지만, 코드를 재게시하는 경우 하우스 룰이 적용된다는 점을 기억하세요.
면책사항
해당 정보와 게시물은 금융, 투자, 트레이딩 또는 기타 유형의 조언이나 권장 사항으로 간주되지 않으며, 트레이딩뷰에서 제공하거나 보증하는 것이 아닙니다. 자세한 내용은 이용 약관을 참조하세요.