PROTECTED SOURCE SCRIPT
업데이트됨 Squeeze Zone
This script supports my previous post Empirical Suite
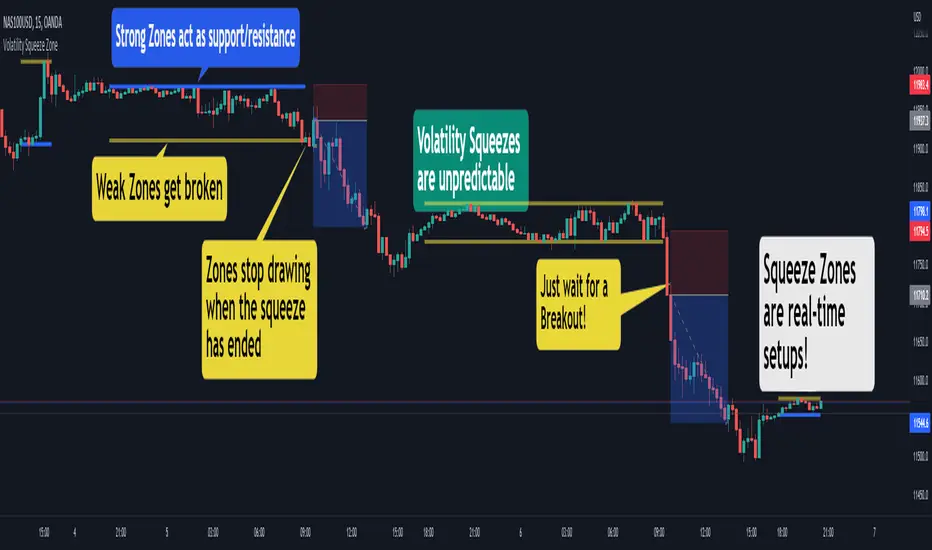
It automatically plots Support and Resistance levels on the chart during periods of volatility squeeze.
You have three plotting methods:
The levels are color-coded:
*Red: weak, one-sided volatility squeeze
*Orange: typically strong, no volatility issue
You can have a double-red zone, where both buying and selling volatility has dropped.
Combine this with the Empirical Suite or your favorite
analysis tools for extra confirmation.
Cheers,
EFX
It automatically plots Support and Resistance levels on the chart during periods of volatility squeeze.
You have three plotting methods:
- From High to Low
- From Open to Close
- Linear Regression (experimental)
The levels are color-coded:
*Red: weak, one-sided volatility squeeze
*Orange: typically strong, no volatility issue
You can have a double-red zone, where both buying and selling volatility has dropped.
Combine this with the Empirical Suite or your favorite
analysis tools for extra confirmation.
Cheers,
EFX
릴리즈 노트
Updated defaultsRemoved poorly performing settings
릴리즈 노트
- Upgrade to Pine V5
- Choose your own colors for Zones!
- Improved default settings
보호된 스크립트입니다
이 스크립트는 비공개 소스로 게시됩니다. 하지만 이를 자유롭게 제한 없이 사용할 수 있습니다 – 자세한 내용은 여기에서 확인하세요.
Algo Trading Simplified 👉 PaxProfits.com
Discover the easy way to manage Forex trading accounts. Trusted by traders globally.
Discover the easy way to manage Forex trading accounts. Trusted by traders globally.
면책사항
해당 정보와 게시물은 금융, 투자, 트레이딩 또는 기타 유형의 조언이나 권장 사항으로 간주되지 않으며, 트레이딩뷰에서 제공하거나 보증하는 것이 아닙니다. 자세한 내용은 이용 약관을 참조하세요.