OPEN-SOURCE SCRIPT
업데이트됨 Moving Average Transform
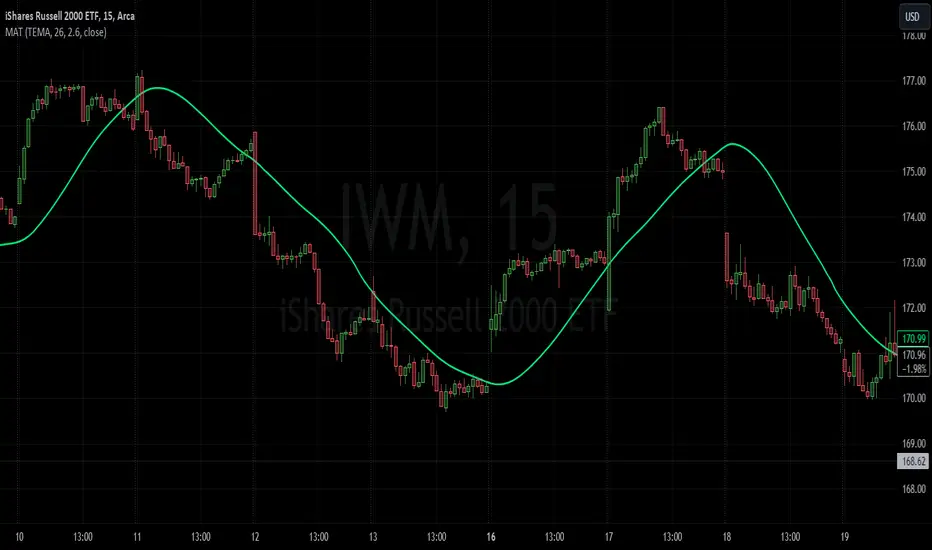
The MAT is essentially a different kind of smoothed moving average. It is made to filter out data sets that deviate from the specified absolute threshold and the result becomes a smoothing function. The goal here, inspired by time series analysis within mathematical study, is to eliminate data anomalies and generate a more accurate trendline.
Functionality:
This script calculates a filtered average by:
The filtered mean is then passed through a moving average function, where various types of moving averages like SMA, EMA, DEMA, TEMA, and ALMA can be applied. Some popular averages such as the HMA were omitted due to their heavy dependency on weighing specific data points.
Some information from "Time Series Analysis" regarding deviations
Approaches to Handle Anomalies?
Detection and Removal
Robust Statistics
Transformation
Functionality:
This script calculates a filtered average by:
- Determining the mean of the entire data series.
- Initializing sum and count variables.
- Iterating through the data to filter values that deviate from the mean beyond the threshold.
- Calculating a filtered mean based on the filtered data.
The filtered mean is then passed through a moving average function, where various types of moving averages like SMA, EMA, DEMA, TEMA, and ALMA can be applied. Some popular averages such as the HMA were omitted due to their heavy dependency on weighing specific data points.
Some information from "Time Series Analysis" regarding deviations
- Definition of Anomaly: An anomaly or outlier is a data point that differs significantly from other observations in the dataset. It can be caused by various reasons such as measurement errors, data entry errors, or genuine extreme observations.
- Impact on Mean: The mean (or average) of a dataset is calculated by summing all the values and dividing by the number of values. Since the mean is sensitive to extreme values, even a single outlier can significantly skew the mean.
- Example: Consider a simple time series dataset: [10, 12, 11, 9, 150]. The value "150" is an anomaly in this context. If we calculate the mean with this outlier, it is (10 + 12 + 11 + 9 + 150) / 5 = 38.4. However, if we exclude the outlier, the mean becomes (10 + 12 + 11 + 9) / 4 = 10.5. The presence of the outlier has substantially increased the mean.
- Accuracy and Representativeness: While the mean calculated without outliers might be more "accurate" in the sense of being more representative of the central tendency of the bulk of the data, it's essential to note that anomalies might convey important information about the system being studied. Blindly removing or ignoring them might lead to overlooking significant events or phenomena.
Approaches to Handle Anomalies?
Detection and Removal
Robust Statistics
Transformation
릴리즈 노트
Implemented ZLEMA option and updated plotting오픈 소스 스크립트
트레이딩뷰의 진정한 정신에 따라, 이 스크립트의 작성자는 이를 오픈소스로 공개하여 트레이더들이 기능을 검토하고 검증할 수 있도록 했습니다. 작성자에게 찬사를 보냅니다! 이 코드는 무료로 사용할 수 있지만, 코드를 재게시하는 경우 하우스 룰이 적용된다는 점을 기억하세요.
KP
면책사항
해당 정보와 게시물은 금융, 투자, 트레이딩 또는 기타 유형의 조언이나 권장 사항으로 간주되지 않으며, 트레이딩뷰에서 제공하거나 보증하는 것이 아닙니다. 자세한 내용은 이용 약관을 참조하세요.
오픈 소스 스크립트
트레이딩뷰의 진정한 정신에 따라, 이 스크립트의 작성자는 이를 오픈소스로 공개하여 트레이더들이 기능을 검토하고 검증할 수 있도록 했습니다. 작성자에게 찬사를 보냅니다! 이 코드는 무료로 사용할 수 있지만, 코드를 재게시하는 경우 하우스 룰이 적용된다는 점을 기억하세요.
KP
면책사항
해당 정보와 게시물은 금융, 투자, 트레이딩 또는 기타 유형의 조언이나 권장 사항으로 간주되지 않으며, 트레이딩뷰에서 제공하거나 보증하는 것이 아닙니다. 자세한 내용은 이용 약관을 참조하세요.