OPEN-SOURCE SCRIPT
Trend Counter [BigBeluga]

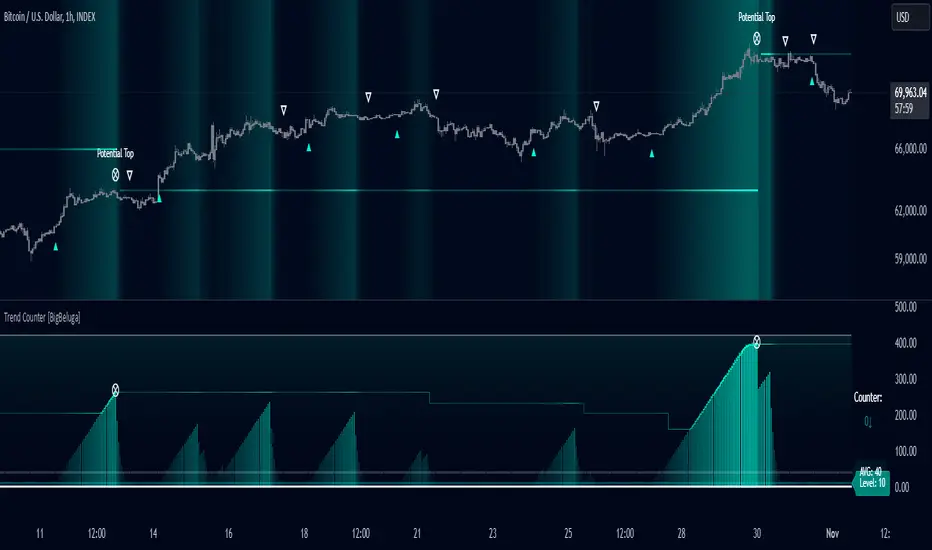
The Trend Counter indicator is designed to help traders identify trend conditions and potential reversals by counting the number of bars within a specified period that are above or below an average price level. By smoothing and averaging these counts, the indicator provides a clear visual representation of market trends and highlights key trend changes.
Key Features:
⦾ Trend Counting:
Counts bars above and below average price levels over a specified period.
Smooths and rounds the count for better visualization.
Pine Script®
⦿ Color Indication:
Uses gradient colors to indicate the strength of the trend.
Colors the background based on trend strength for easier interpretation.

⦿ Trend Signals:
Provides visual cues for trend changes based on the counter crossing predefined levels.

⦿ Potential Tops:
Identifies potential market tops using a specified length and highlights these levels.

⦿ Additional Features:
Displays Trend Counter value with arrows to indicate the direction of the trend movement.
Displays average trend count and level for reference.

⦿ User Inputs Description
The Trend Counter indicator is a powerful tool for traders seeking to identify and visualize market trends.
By counting and smoothing price bars above and below average levels, it provides clear and intuitive signals for trend strength and potential reversals.
With customizable parameters and visual cues, the Trend Counter enhances trend analysis and decision-making for traders of all levels.
Key Features:
⦾ Trend Counting:
Counts bars above and below average price levels over a specified period.
Smooths and rounds the count for better visualization.
// Count bars over length period above highest and lowest avg with offset loop
float mid = math.avg(ta.highest(length), ta.lowest(length))
for offset = 0 to length -1
switch
hl2 > mid[offset] => counter += 1.0
=> counter := 0.0
// Smooth Count and Round
counter := math.round(ta.ema(counter > 400 ? 400 : counter, smooth))
// Count Avg
count.push(counter)
avg = math.round(count.avg())
⦿ Color Indication:
Uses gradient colors to indicate the strength of the trend.
Colors the background based on trend strength for easier interpretation.
⦿ Trend Signals:
Provides visual cues for trend changes based on the counter crossing predefined levels.
⦿ Potential Tops:
Identifies potential market tops using a specified length and highlights these levels.
⦿ Additional Features:
Displays Trend Counter value with arrows to indicate the direction of the trend movement.
Displays average trend count and level for reference.
⦿ User Inputs Description
- Length: Defines the period over which the trend counting is performed.
- Trend Counter Smooth: Specifies the smoothing period for the trend counter.
- Level: Sets the threshold level for trend signals.
- Main Color: Determines the primary color for trend indication.
The Trend Counter indicator is a powerful tool for traders seeking to identify and visualize market trends.
By counting and smoothing price bars above and below average levels, it provides clear and intuitive signals for trend strength and potential reversals.
With customizable parameters and visual cues, the Trend Counter enhances trend analysis and decision-making for traders of all levels.
오픈 소스 스크립트
트레이딩뷰의 진정한 정신에 따라, 이 스크립트의 작성자는 이를 오픈소스로 공개하여 트레이더들이 기능을 검토하고 검증할 수 있도록 했습니다. 작성자에게 찬사를 보냅니다! 이 코드는 무료로 사용할 수 있지만, 코드를 재게시하는 경우 하우스 룰이 적용된다는 점을 기억하세요.
🔵Gain access to our powerful tools : bigbeluga.com/tv
🔵Join our free discord for updates : bigbeluga.com/discord
All scripts & content provided by BigBeluga are for informational & educational purposes only.
🔵Join our free discord for updates : bigbeluga.com/discord
All scripts & content provided by BigBeluga are for informational & educational purposes only.
면책사항
해당 정보와 게시물은 금융, 투자, 트레이딩 또는 기타 유형의 조언이나 권장 사항으로 간주되지 않으며, 트레이딩뷰에서 제공하거나 보증하는 것이 아닙니다. 자세한 내용은 이용 약관을 참조하세요.