OPEN-SOURCE SCRIPT
업데이트됨 VPA Volume Price Average
Description:
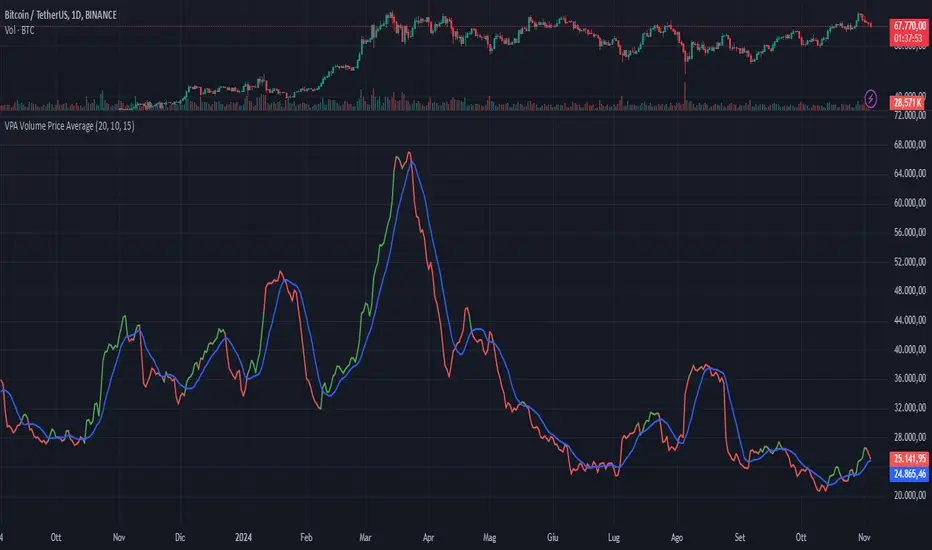
This indicator displays a moving average of volume and its signal line in a separate pane, with conditional highlighting to help interpret buyer and seller pressure. It’s based on two main lines:
Volume Moving Average (red line): represents the average volume calculated over a configurable number of periods.
Signal Line of the Volume Moving Average (blue line): this is an average of the volume moving average itself, used as a reference for volume trends.
Key Features
Volume Moving Average with Conditional Highlighting:
The volume moving average is plotted as a red line and changes color based on two specific conditions:
The closing price is above its moving average, calculated over a configurable number of periods, indicating a bullish trend.
The volume moving average is greater than the signal line, suggesting an increase in buyer pressure.
When both conditions are met, the volume moving average turns green. If one or both conditions are not met, the line remains red.
Signal Line of the Volume Moving Average:
The signal line is plotted in blue and represents a smoothed version of the volume moving average, useful for identifying long-term volume trends and as a reference for the highlighting condition.
Customizable Periods
The indicator allows you to set the periods for each average to adapt to different timeframes and desired sensitivity:
Period for calculating the volume moving average.
Period for calculating the signal line of the volume moving average.
Period for the price moving average (used in the highlighting condition).
How to Use
This indicator is especially useful for monitoring volume dynamics in detail, with a visual system that highlights conditions of increasing buyer strength when the price is in an uptrend. The green highlight on the volume moving average provides an intuitive signal for identifying potential moments of buyer support.
Try it to gain a clearer and more focused view of volume behavior relative to price movement!
릴리즈 노트
Description:This indicator displays a moving average of volume and its signal line in a separate pane, with conditional highlighting to help interpret buyer and seller pressure. It’s based on two main lines:
Volume Moving Average (red line): represents the average volume calculated over a configurable number of periods.
Signal Line of the Volume Moving Average (blue line): this is an average of the volume moving average itself, used as a reference for volume trends.
Key Features
Volume Moving Average with Conditional Highlighting:
The volume moving average is plotted as a red line and changes color based on two specific conditions:
The closing price is above its moving average, calculated over a configurable number of periods, indicating a bullish trend.
The volume moving average is greater than the signal line, suggesting an increase in buyer pressure.
When both conditions are met, the volume moving average turns green. If one or both conditions are not met, the line remains red.
Signal Line of the Volume Moving Average:
The signal line is plotted in blue and represents a smoothed version of the volume moving average, useful for identifying long-term volume trends and as a reference for the highlighting condition.
Customizable Periods
The indicator allows you to set the periods for each average to adapt to different timeframes and desired sensitivity:
Period for calculating the volume moving average.
Period for calculating the signal line of the volume moving average.
Period for the price moving average (used in the highlighting condition).
How to Use
This indicator is especially useful for monitoring volume dynamics in detail, with a visual system that highlights conditions of increasing buyer strength when the price is in an uptrend. The green highlight on the volume moving average provides an intuitive signal for identifying potential moments of buyer support.
Try it to gain a clearer and more focused view of volume behavior relative to price movement!
오픈 소스 스크립트
트레이딩뷰의 진정한 정신에 따라, 이 스크립트의 작성자는 이를 오픈소스로 공개하여 트레이더들이 기능을 검토하고 검증할 수 있도록 했습니다. 작성자에게 찬사를 보냅니다! 이 코드는 무료로 사용할 수 있지만, 코드를 재게시하는 경우 하우스 룰이 적용된다는 점을 기억하세요.
면책사항
해당 정보와 게시물은 금융, 투자, 트레이딩 또는 기타 유형의 조언이나 권장 사항으로 간주되지 않으며, 트레이딩뷰에서 제공하거나 보증하는 것이 아닙니다. 자세한 내용은 이용 약관을 참조하세요.
오픈 소스 스크립트
트레이딩뷰의 진정한 정신에 따라, 이 스크립트의 작성자는 이를 오픈소스로 공개하여 트레이더들이 기능을 검토하고 검증할 수 있도록 했습니다. 작성자에게 찬사를 보냅니다! 이 코드는 무료로 사용할 수 있지만, 코드를 재게시하는 경우 하우스 룰이 적용된다는 점을 기억하세요.
면책사항
해당 정보와 게시물은 금융, 투자, 트레이딩 또는 기타 유형의 조언이나 권장 사항으로 간주되지 않으며, 트레이딩뷰에서 제공하거나 보증하는 것이 아닙니다. 자세한 내용은 이용 약관을 참조하세요.