OPEN-SOURCE SCRIPT
업데이트됨 ka66: Swing/Pivot Point Lines
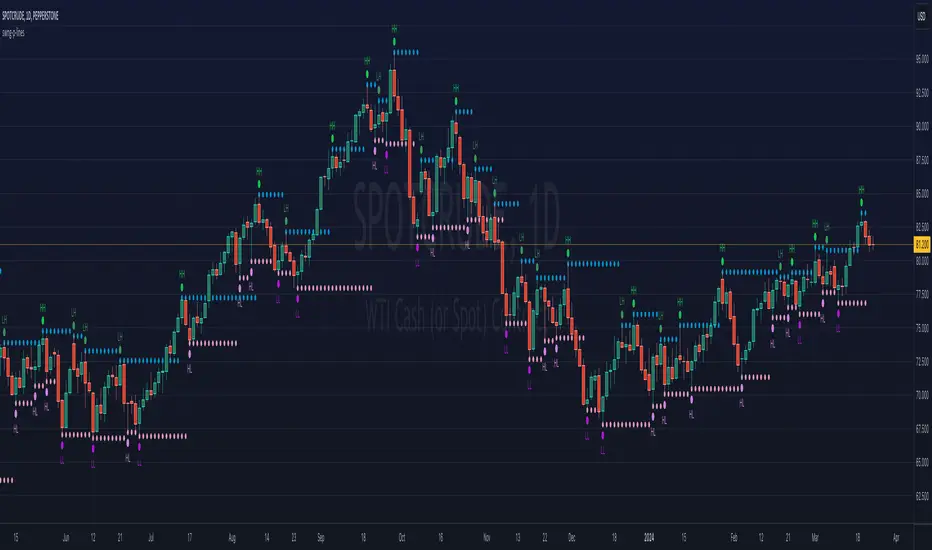
This indicator draws swing-highs and swing-lows, also called pivot highs and lows.
A swing high is a bar which has a higher-high than its surrounding bars (to the left and the right).
A swing low is a bar which has a lower-low than its surrounding bars (to the left and the right).
A common example of a pivot is Bill Williams' Fractal, which specifies that the centre bar must have a higher high than 2 bars to its left, and 2 bars to its right for a swing high, taking into account 5 bars at a time. Similarly, for a swing low, the centre bar must have a lower low than the 2 bars to its left and right.
This indicator allows configurable adjacent bars as input. Entering 2, means it essentially picks out a Williams Fractal. But you can select 1 (say for higher timeframes), using one 1 bar to the left and right of the centre bar.
The indicator will draw Swing/Pivot High/Low as circles at the same price level as the centre bar, till the next one shows up. Drawing is offset so it starts at the centre bar (the swing bar), showing exactly where the pivot bar is.
There are 2 main uses of pivot points, in various strategies:
Messy pivot structures easily point out ranging markets.
There are a few of these, some closed source, which I don't like, since I think people should generally know what they are trading with, and I want to make sure I understand the logic exactly.
A swing high is a bar which has a higher-high than its surrounding bars (to the left and the right).
A swing low is a bar which has a lower-low than its surrounding bars (to the left and the right).
A common example of a pivot is Bill Williams' Fractal, which specifies that the centre bar must have a higher high than 2 bars to its left, and 2 bars to its right for a swing high, taking into account 5 bars at a time. Similarly, for a swing low, the centre bar must have a lower low than the 2 bars to its left and right.
This indicator allows configurable adjacent bars as input. Entering 2, means it essentially picks out a Williams Fractal. But you can select 1 (say for higher timeframes), using one 1 bar to the left and right of the centre bar.
The indicator will draw Swing/Pivot High/Low as circles at the same price level as the centre bar, till the next one shows up. Drawing is offset so it starts at the centre bar (the swing bar), showing exactly where the pivot bar is.
There are 2 main uses of pivot points, in various strategies:
- Market Structure: to objectively define higher-highs/lows and lower-highs/lows in Trend Analysis.
- More generally, to then determine if a trend might reverse, or continue as pivot levels are broken.
Messy pivot structures easily point out ranging markets.
There are a few of these, some closed source, which I don't like, since I think people should generally know what they are trading with, and I want to make sure I understand the logic exactly.
릴리즈 노트
Label relative swing points as per Dow Theory, useful user request:- Higher Highs (HH)
- Higher Lows (HL)
- Lower Highs (LH)
- Lower Lows (LL)
오픈 소스 스크립트
트레이딩뷰의 진정한 정신에 따라, 이 스크립트의 작성자는 이를 오픈소스로 공개하여 트레이더들이 기능을 검토하고 검증할 수 있도록 했습니다. 작성자에게 찬사를 보냅니다! 이 코드는 무료로 사용할 수 있지만, 코드를 재게시하는 경우 하우스 룰이 적용된다는 점을 기억하세요.
면책사항
해당 정보와 게시물은 금융, 투자, 트레이딩 또는 기타 유형의 조언이나 권장 사항으로 간주되지 않으며, 트레이딩뷰에서 제공하거나 보증하는 것이 아닙니다. 자세한 내용은 이용 약관을 참조하세요.
오픈 소스 스크립트
트레이딩뷰의 진정한 정신에 따라, 이 스크립트의 작성자는 이를 오픈소스로 공개하여 트레이더들이 기능을 검토하고 검증할 수 있도록 했습니다. 작성자에게 찬사를 보냅니다! 이 코드는 무료로 사용할 수 있지만, 코드를 재게시하는 경우 하우스 룰이 적용된다는 점을 기억하세요.
면책사항
해당 정보와 게시물은 금융, 투자, 트레이딩 또는 기타 유형의 조언이나 권장 사항으로 간주되지 않으며, 트레이딩뷰에서 제공하거나 보증하는 것이 아닙니다. 자세한 내용은 이용 약관을 참조하세요.