OPEN-SOURCE SCRIPT
RahulLines Cloud
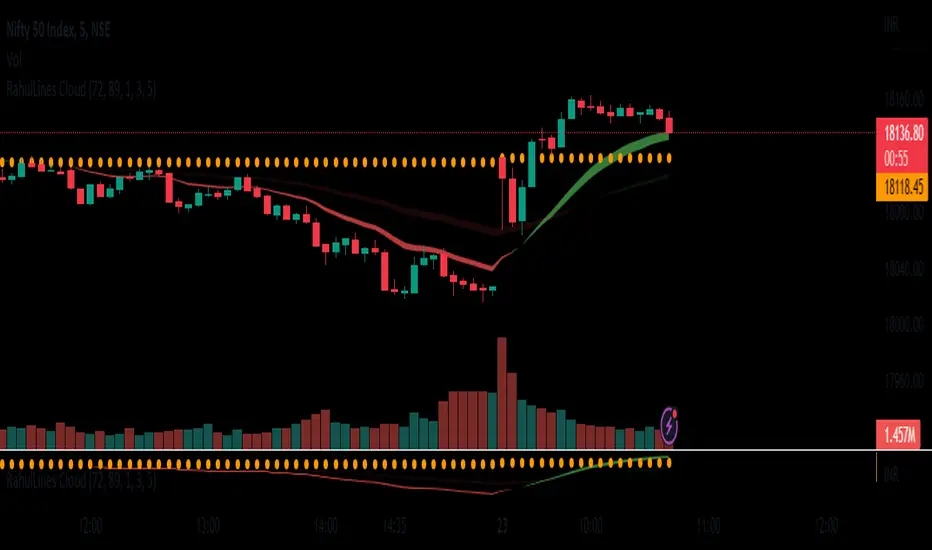
J-Lines Cloud is a technical analysis tool that is used to identify potential support and resistance levels on a chart. It is based on the concept of the "J-Lines," which are lines that are drawn on a chart in order to identify potential turning points in price. The J-Lines Cloud is a variation of the J-Lines that is used to identify levels of support and resistance using cloud, it typically uses multiple lines to create a cloud-like shape, which represents a zone of support or resistance.
To use the J-Lines Cloud, you will typically need a charting platform that has the ability to plot the J-Lines Cloud indicator. The indicator will typically take the form of a cloud-like shape on the chart, with different colors used to represent different levels of support and resistance.
Once the J-Lines Cloud is plotted on the chart, traders can use it to identify potential levels at which the price of an asset may change direction. For example, if the price of an asset is approaching a level of resistance identified by the J-Lines Cloud, a trader may choose to sell or exit a long position. Conversely, if the price of an asset is approaching a level of support identified by the J-Lines Cloud, a trader may choose to buy or enter a long position.
It's important to note that the J-Lines Cloud is a tool for technical analysis and not a standalone strategy, it should be used in combination with other indicators or strategies and also it should be used with the proper risk management and stop loss analysis.
오픈 소스 스크립트
트레이딩뷰의 진정한 정신에 따라, 이 스크립트의 작성자는 이를 오픈소스로 공개하여 트레이더들이 기능을 검토하고 검증할 수 있도록 했습니다. 작성자에게 찬사를 보냅니다! 이 코드는 무료로 사용할 수 있지만, 코드를 재게시하는 경우 하우스 룰이 적용된다는 점을 기억하세요.
면책사항
해당 정보와 게시물은 금융, 투자, 트레이딩 또는 기타 유형의 조언이나 권장 사항으로 간주되지 않으며, 트레이딩뷰에서 제공하거나 보증하는 것이 아닙니다. 자세한 내용은 이용 약관을 참조하세요.
오픈 소스 스크립트
트레이딩뷰의 진정한 정신에 따라, 이 스크립트의 작성자는 이를 오픈소스로 공개하여 트레이더들이 기능을 검토하고 검증할 수 있도록 했습니다. 작성자에게 찬사를 보냅니다! 이 코드는 무료로 사용할 수 있지만, 코드를 재게시하는 경우 하우스 룰이 적용된다는 점을 기억하세요.
면책사항
해당 정보와 게시물은 금융, 투자, 트레이딩 또는 기타 유형의 조언이나 권장 사항으로 간주되지 않으며, 트레이딩뷰에서 제공하거나 보증하는 것이 아닙니다. 자세한 내용은 이용 약관을 참조하세요.