OPEN-SOURCE SCRIPT
Ranked Parabolic Curve Detector (Adaptive + Reversion Aware)
The Parabolic Curve Detector is a smart, adaptable trading signal engine designed to help you spot true momentum — not the flashy head-fakes, but sustained, accelerating moves that have the potential to go parabolic. Whether you’re new to trading or looking to sharpen your edge, this tool combines a suite of time-tested and modern techniques into one unified signal, all while adjusting to changing market conditions.
The core idea is simple: detect when price is not just rising, but accelerating, like a curve bending upward. To do that, the script analyzes the log of price and calculates both:
Slope1: how fast the price is moving (momentum)
Slope2: how fast that momentum is changing (acceleration)
Over a user-defined number of bars (which amounts to sensitivity), the script checks for consistency. So, for example, if both slope1 and slope2 have been positive for 4 bars, that’s a strong signal.
But it doesn’t stop there.
The key is weighted Intelligence
What makes this tool uniquely customizable is that each layer of signal logic is weighted:
Slope1 and Slope2: You can assign how much these matter (e.g., 60% for slope1, 20% for slope2)
Ichimoku Trend Filter: A bullish setup (Tenkan > Kijun) can contribute to the total score
RSI Context: The indicator checks for overextension (RSI > 70 and falling) and mean-reversion potential (RSI < 45 and rising), adjusting scores accordingly
You can fine-tune these weights to match your trading style — whether you prefer to catch early momentum, ride mature trends, or fade reversals.
Finally, there is adaptive Intelligence. This isn’t a static signal. The indicator auto-adjusts its strictness using:
Slope Flip Rate: If price changes direction frequently, the required bar count increases
Volatility (ATR): In volatile markets, the threshold for signal confirmation tightens to avoid noise
You can turn this adaptive behavior on or off. When enabled, it makes the script self-tuning across timeframes — more reactive on clean moves, more skeptical in chop.
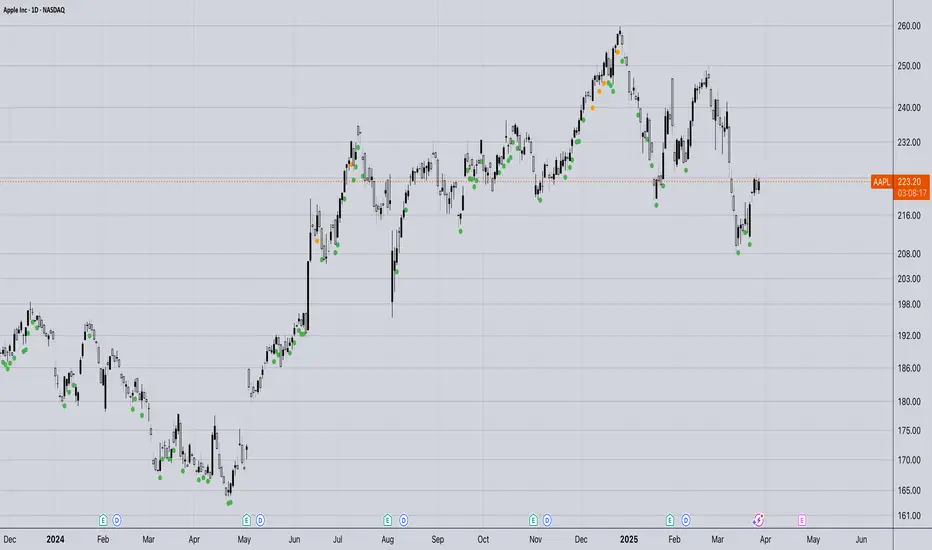
How to Use It
Start on a log-scaled daily chart
Enable the indicator and optionally turn on Adaptive Sensitivity
Look for:
Green Circles = bullish signal with favorable RSI + trend
Orange Circles = still bullish, but possibly overextended
For bearish setups, enable Parabolic Drops in settings
I am still experimenting with it, so if you find a better way to use it, let us know!
My suggested tweaks:
sensitivity: 3–5 for normal, higher for stricter
signalThreshold: 0.7–0.85 depending on how picky you want to be
Weights for slope1/slope2/trend
RSI boost/penalty levels
The core idea is simple: detect when price is not just rising, but accelerating, like a curve bending upward. To do that, the script analyzes the log of price and calculates both:
Slope1: how fast the price is moving (momentum)
Slope2: how fast that momentum is changing (acceleration)
Over a user-defined number of bars (which amounts to sensitivity), the script checks for consistency. So, for example, if both slope1 and slope2 have been positive for 4 bars, that’s a strong signal.
But it doesn’t stop there.
The key is weighted Intelligence
What makes this tool uniquely customizable is that each layer of signal logic is weighted:
Slope1 and Slope2: You can assign how much these matter (e.g., 60% for slope1, 20% for slope2)
Ichimoku Trend Filter: A bullish setup (Tenkan > Kijun) can contribute to the total score
RSI Context: The indicator checks for overextension (RSI > 70 and falling) and mean-reversion potential (RSI < 45 and rising), adjusting scores accordingly
You can fine-tune these weights to match your trading style — whether you prefer to catch early momentum, ride mature trends, or fade reversals.
Finally, there is adaptive Intelligence. This isn’t a static signal. The indicator auto-adjusts its strictness using:
Slope Flip Rate: If price changes direction frequently, the required bar count increases
Volatility (ATR): In volatile markets, the threshold for signal confirmation tightens to avoid noise
You can turn this adaptive behavior on or off. When enabled, it makes the script self-tuning across timeframes — more reactive on clean moves, more skeptical in chop.
How to Use It
Start on a log-scaled daily chart
Enable the indicator and optionally turn on Adaptive Sensitivity
Look for:
Green Circles = bullish signal with favorable RSI + trend
Orange Circles = still bullish, but possibly overextended
For bearish setups, enable Parabolic Drops in settings
I am still experimenting with it, so if you find a better way to use it, let us know!
My suggested tweaks:
sensitivity: 3–5 for normal, higher for stricter
signalThreshold: 0.7–0.85 depending on how picky you want to be
Weights for slope1/slope2/trend
RSI boost/penalty levels
오픈 소스 스크립트
트레이딩뷰의 진정한 정신에 따라, 이 스크립트의 작성자는 이를 오픈소스로 공개하여 트레이더들이 기능을 검토하고 검증할 수 있도록 했습니다. 작성자에게 찬사를 보냅니다! 이 코드는 무료로 사용할 수 있지만, 코드를 재게시하는 경우 하우스 룰이 적용된다는 점을 기억하세요.
면책사항
해당 정보와 게시물은 금융, 투자, 트레이딩 또는 기타 유형의 조언이나 권장 사항으로 간주되지 않으며, 트레이딩뷰에서 제공하거나 보증하는 것이 아닙니다. 자세한 내용은 이용 약관을 참조하세요.
오픈 소스 스크립트
트레이딩뷰의 진정한 정신에 따라, 이 스크립트의 작성자는 이를 오픈소스로 공개하여 트레이더들이 기능을 검토하고 검증할 수 있도록 했습니다. 작성자에게 찬사를 보냅니다! 이 코드는 무료로 사용할 수 있지만, 코드를 재게시하는 경우 하우스 룰이 적용된다는 점을 기억하세요.
면책사항
해당 정보와 게시물은 금융, 투자, 트레이딩 또는 기타 유형의 조언이나 권장 사항으로 간주되지 않으며, 트레이딩뷰에서 제공하거나 보증하는 것이 아닙니다. 자세한 내용은 이용 약관을 참조하세요.