OPEN-SOURCE SCRIPT
Pivot Market Structure
Description and Features
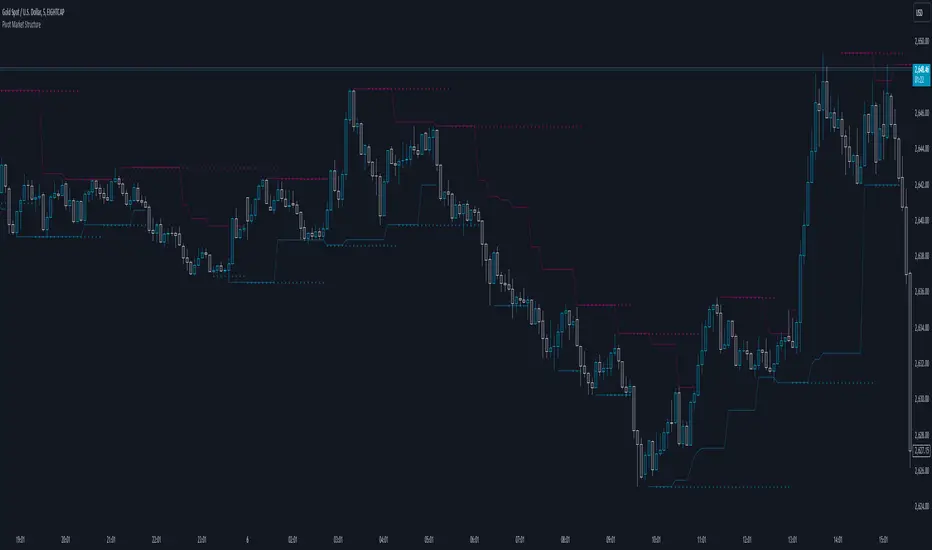
This script is designed to enhance technical analysis by identifying key market structure levels. It uses a price action trail (based on the last highest/lowest price) and pivot points to track market trends, offering insights into potential reversal zones or trend continuation signals.
How the Script Works
Summary
By combining both pivot analysis and price action trailing techniques, the script provides a comprehensive view of a pivot point based market structure.
This script is designed to enhance technical analysis by identifying key market structure levels. It uses a price action trail (based on the last highest/lowest price) and pivot points to track market trends, offering insights into potential reversal zones or trend continuation signals.
How the Script Works
- High/Low Trail Logic: The script includes a trail mechanism that compares the current price with the last highest and lowest price, determining whether the price has breached these levels. This helps pinpoint key price action events and potential trend shifts. Unlike pivot points the price action trail is more responsive changes within the market structure.
Step Size and Length for High/Low Trail:
- The Step Length parameter defines how many bars are used to compare the current price against the last highest/lowest price, providing a measure of price extremes.
- The Length parameter determines the number of bars considered for calculating the highest/lowest price since the last price action event (either price surpassing a previous high or dipping below a previous low).
- Pivot Point Calculation: Pivot Point Highs are calculated by the number of bars with lower highs on either side of a Pivot Point High calculation. Similarly, Pivot Point Lows are calculated by the number of bars with higher lows on either side of a Pivot Point Low calculation. The script draws a line from/to every calculated pivot point to highlight market structure extremes. It can optionally extend these pivot lines to the left for added context, providing historical reference for decision-making.
Summary
By combining both pivot analysis and price action trailing techniques, the script provides a comprehensive view of a pivot point based market structure.
오픈 소스 스크립트
트레이딩뷰의 진정한 정신에 따라, 이 스크립트의 작성자는 이를 오픈소스로 공개하여 트레이더들이 기능을 검토하고 검증할 수 있도록 했습니다. 작성자에게 찬사를 보냅니다! 이 코드는 무료로 사용할 수 있지만, 코드를 재게시하는 경우 하우스 룰이 적용된다는 점을 기억하세요.
면책사항
해당 정보와 게시물은 금융, 투자, 트레이딩 또는 기타 유형의 조언이나 권장 사항으로 간주되지 않으며, 트레이딩뷰에서 제공하거나 보증하는 것이 아닙니다. 자세한 내용은 이용 약관을 참조하세요.
오픈 소스 스크립트
트레이딩뷰의 진정한 정신에 따라, 이 스크립트의 작성자는 이를 오픈소스로 공개하여 트레이더들이 기능을 검토하고 검증할 수 있도록 했습니다. 작성자에게 찬사를 보냅니다! 이 코드는 무료로 사용할 수 있지만, 코드를 재게시하는 경우 하우스 룰이 적용된다는 점을 기억하세요.
면책사항
해당 정보와 게시물은 금융, 투자, 트레이딩 또는 기타 유형의 조언이나 권장 사항으로 간주되지 않으며, 트레이딩뷰에서 제공하거나 보증하는 것이 아닙니다. 자세한 내용은 이용 약관을 참조하세요.